Experimental Validation of Quantum Entanglement Using Affordable Apparatus
Awards
Northeastern NM Regional Science and Engineering Fair: 1st Place in Senior Physics Category.
New Mexico Science and Engineering Fair: 1st Place in Senior Physics Category.
Research Objective
Demonstrate quantum entanglement of gamma photons in an affordable manner by using homemade particle detectors.
Introduction
History
Quantum mechanics in its earliest stage was developed to explain the black-body radiation problem and the photoelectric effect discovered by Heinrich Hertz. The origin of its name can be found in Max Planck's hypothesis that the energy radiating from atomic system can be divided into a number of discrete energy elements. The theory was further developed by Albert Einstein, Niels Bohr, Louis de Brogile, Werner Heisenberg, Erwin Schrodinger and validated by many experiments that demonstrate the characteristics of the elementary particles. Today, quantum theory describes the nature of atoms and subatomic particles at the smallest scales.
Quantum Entanglement
Originally described in the Einstein, Podolsky, and Rosen (EPR) Paradox as proof that quantum mechanics was incorrect or incomplete.
Defined as separate particles that act as one entity, in the sense that one particle cannot be fully described without the other.
Experiments testing Bell's theorem disproved EPR's argument, leading scientists to modify the definition of entanglement into what it is today.
The most notable experiment proving quantum entanglement was the Wu-Shaknov experiment, The Angular Correlation of Scattered Annihilation Radiation. In the experiment, Wu and Shaknov used a Cu radioactive source to produce electrons and positrons, which would then annihilate each other. Although it was unknown at the time of this experiment, entangled particles are a result of this annihilation.
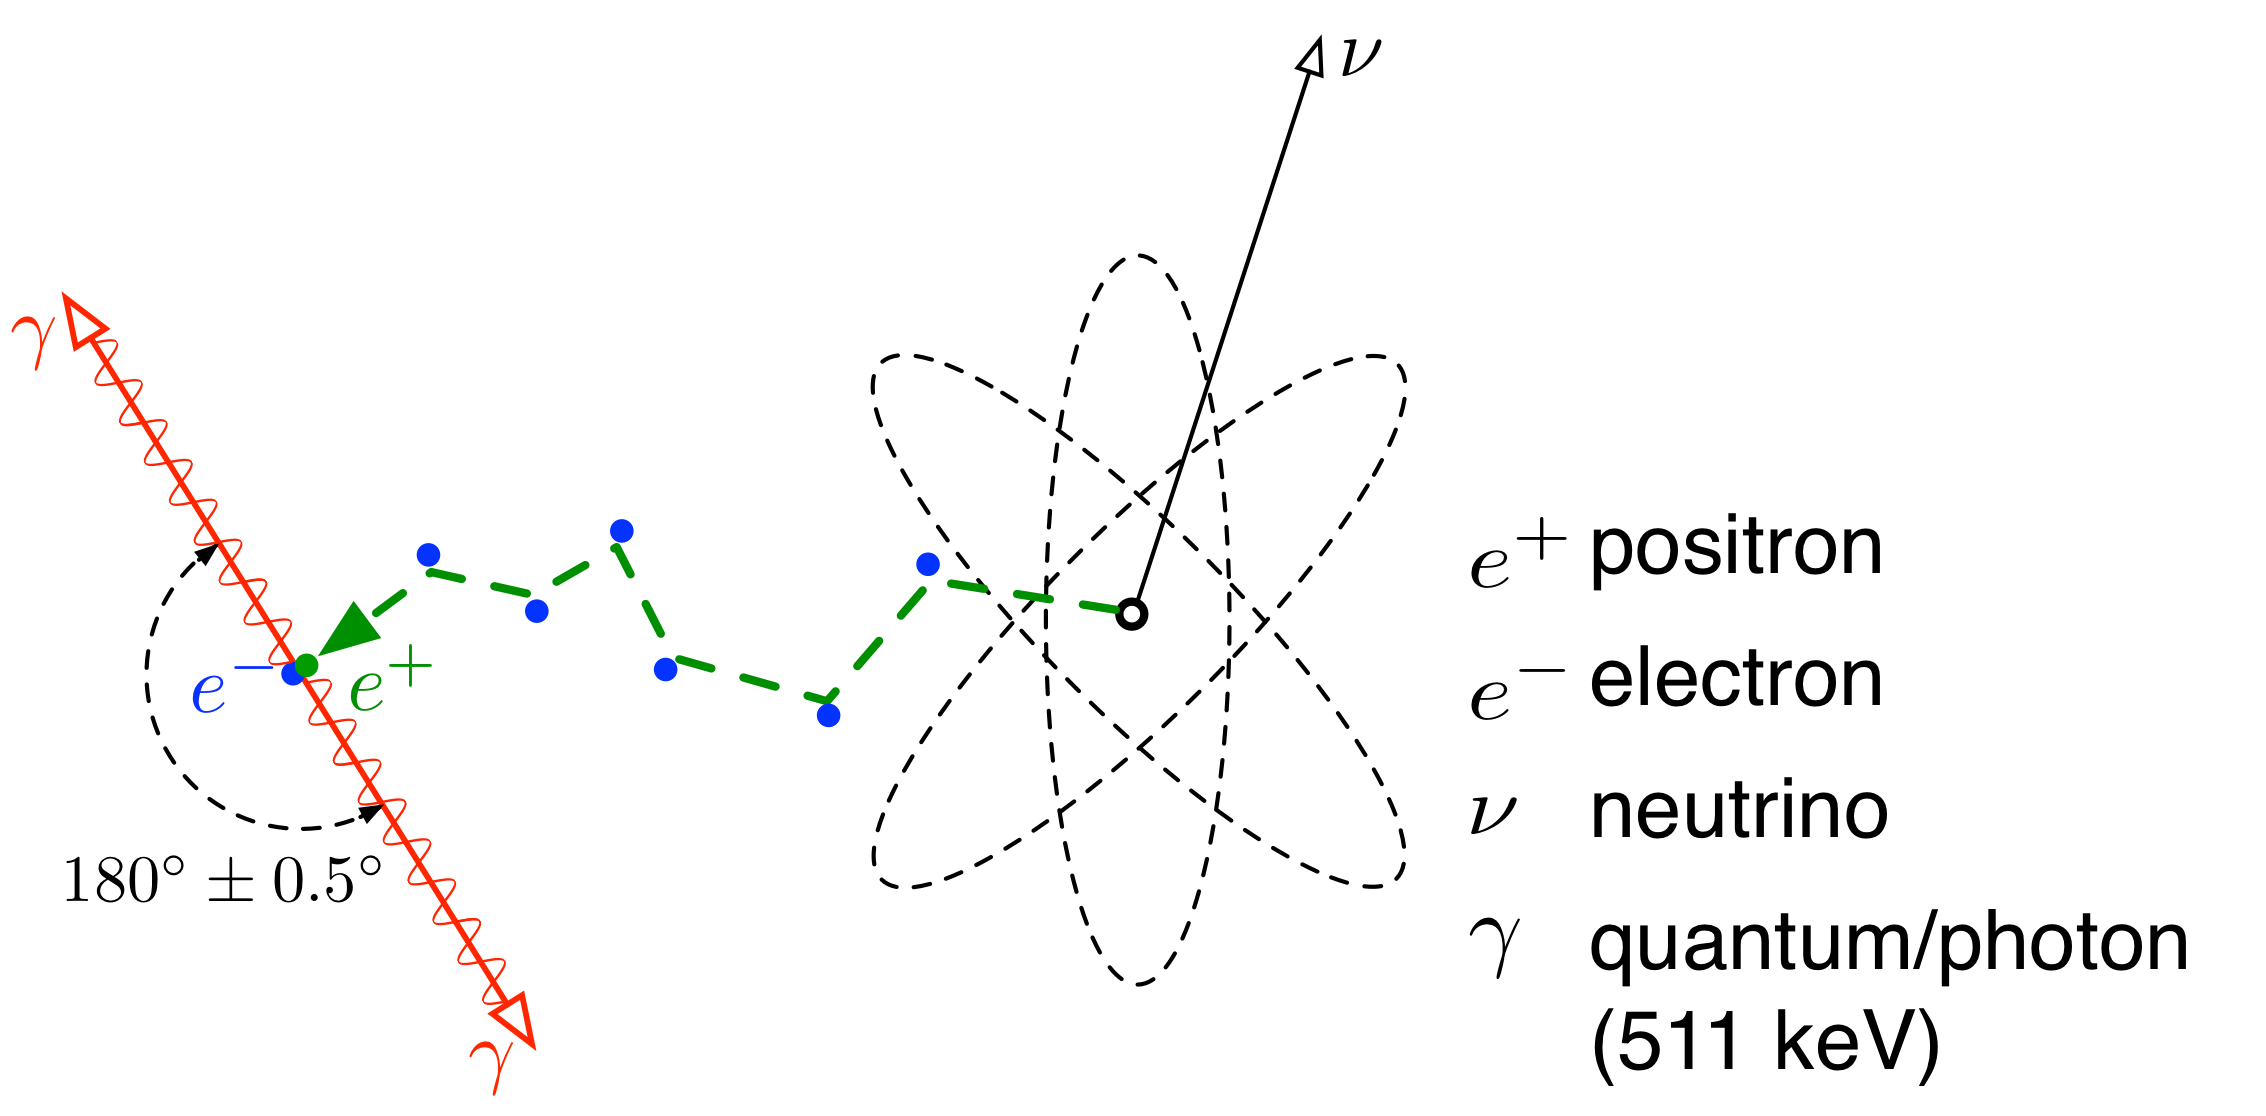 Figure 1: Positron-Electron Annihilation
Background
Compton Scattering
A phenomenon in which x-ray or gamma ray photons collide with electrons and scatter off of them.
Metals can be used as photon polarizers because of this effect.
where is the wavelength after scattering, is the initial wavelength, is the Planck constant, is the electron rest mass, is the speed of light, and is the scattering angle.
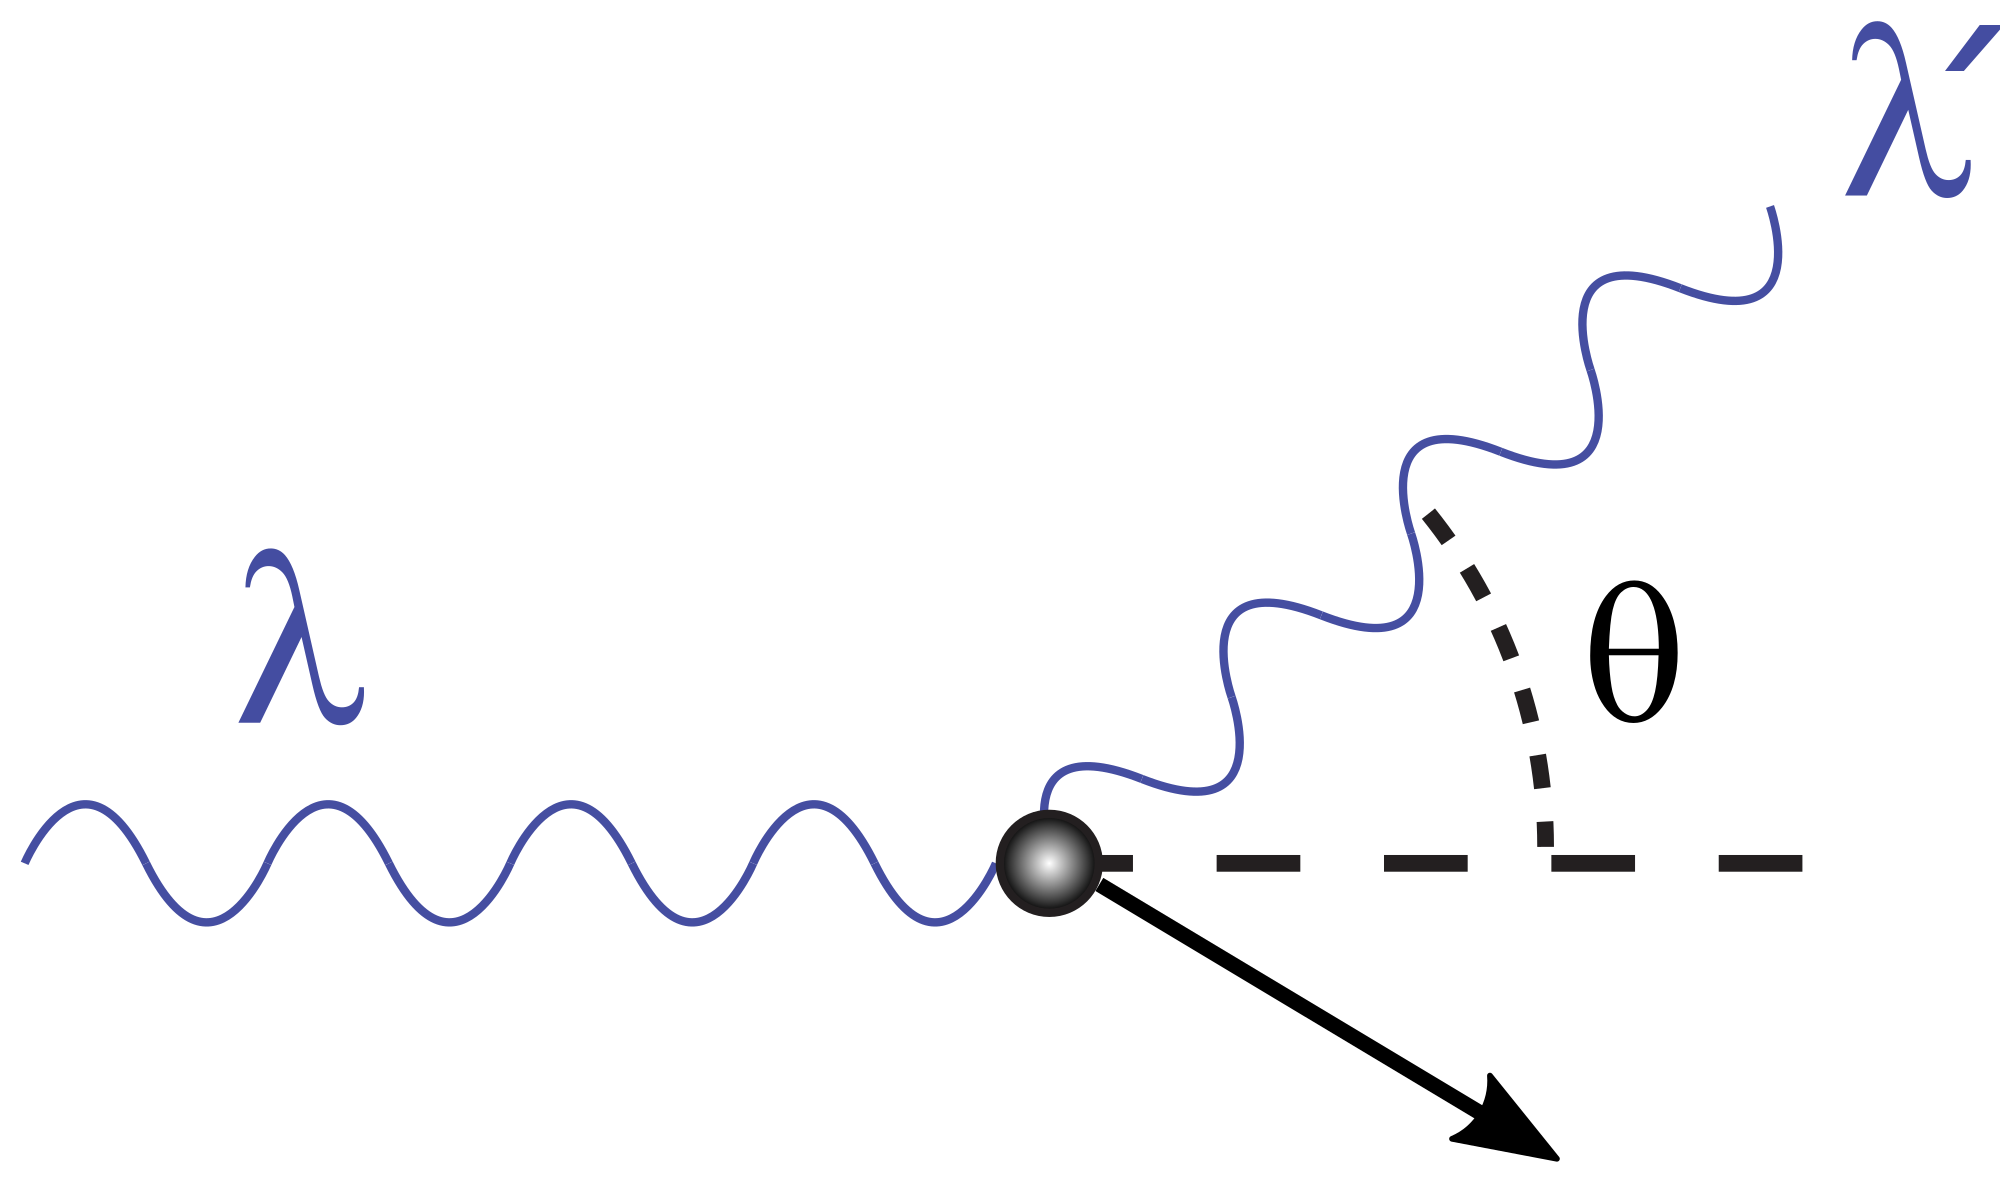 Figure 2: Compton Scattering
If two photons produced by annihilation are Compton scattered, the coincidence rate of their angles is given by the following equations:
where is the coincidence rate and is the difference between the scattering angles of the two detectors.
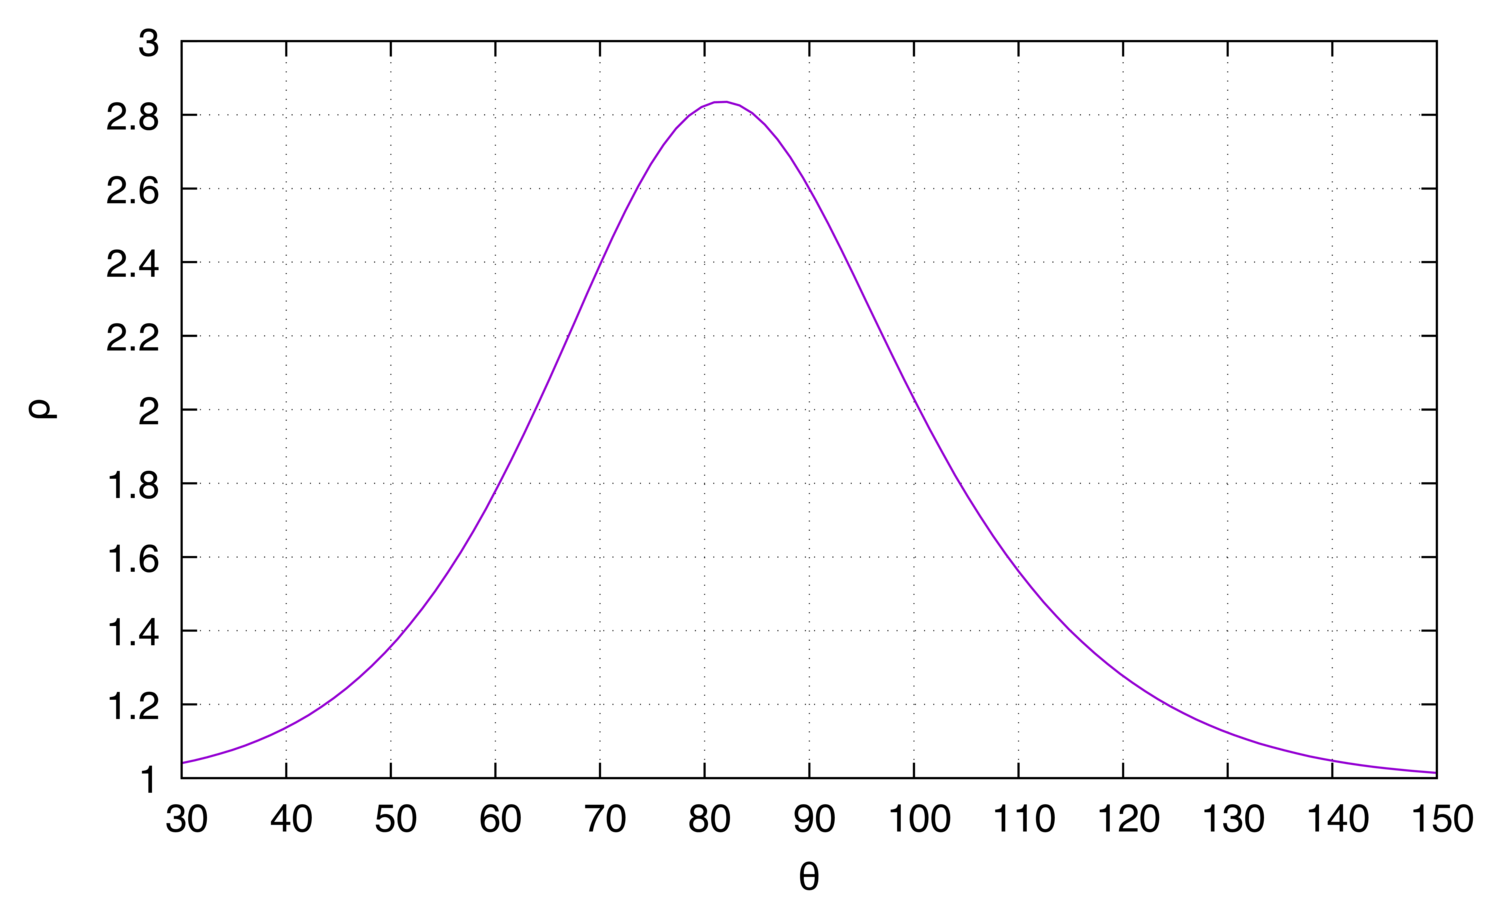 Figure 3: Asymmetry of coincidence rate, as a function of the
scattering angle .
Figure 3: Asymmetry of coincidence rate, as a function of the
scattering angle .
Gamma Spectroscopy
The energy of the gamma rays produced by a radioactive source can be detected by using a scintillation detector; the gamma photon causes the scintillation material to emit light which is detected by a photomultiplier sensor, in this case the silicon photomultiplier (SiPM). The voltage output of the SiPM allows the particle energy to be calculated. Using this energy calculation, a gamma ray spectrum can be produced. Several peaks can be seen on this spectrum, such as the backscatter peak, as well as the Compton edge. The backscatter peak occurs when photons have a certain energy, allowing them to scatter off of the surrounding materials. One example is scattering off of the shielding used for the radioactive source. The Compton edge, however, occurs when particles hit the detector. A smaller energy is detected because of the Compton effect. The photons give energy to the electrons as they scatter off, but at a certain energy, the particles deposit a maximum energy. This deposit is known as the Compton edge.
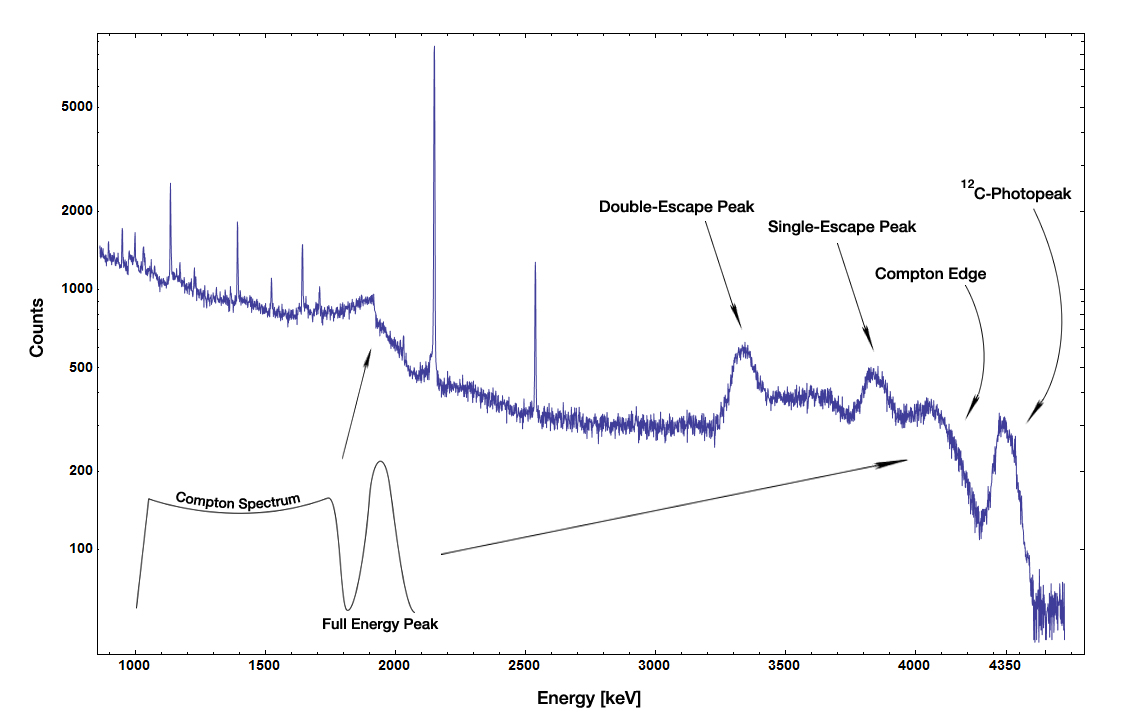 Figure 4: Neutron capture gamma spectrum of a radioactive
Am-Be-source, measured with a germanium detector.
Figure 4: Neutron capture gamma spectrum of a radioactive
Am-Be-source, measured with a germanium detector.
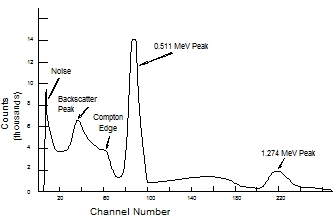
Figure 5: Na gamma ray spectrum.
Building the Particle Detector
My plan was to use two RM-60 Geiger counters and coincidence box as described in George Musser's article. Unfortunately, the company that was producing both went out of business. I had to look for other options that allow two detectors to operate in coincidence mode, but all were very expensive.
I found the CosmicWatch project that describes how to build muon detector for about $100 that supports coincidence mode. It had to be built from scratch. The production of the detector was complicated, but the instructions claimed that a high school student can build it in four hours, so I decided to attempt this project.
Materials
- Electronic components (resistors, capacitors, etc.)
- Printed circuit boards (PCBs)
- Plastic scintillator
- Silicon photomultiplier (SiPM)
- Arduino Nano
- Optical gel
- OLED display
- Black electrical tape
- Reflective aluminum foil
Procedure
Purchase all components listed on the CosmicWatch website.
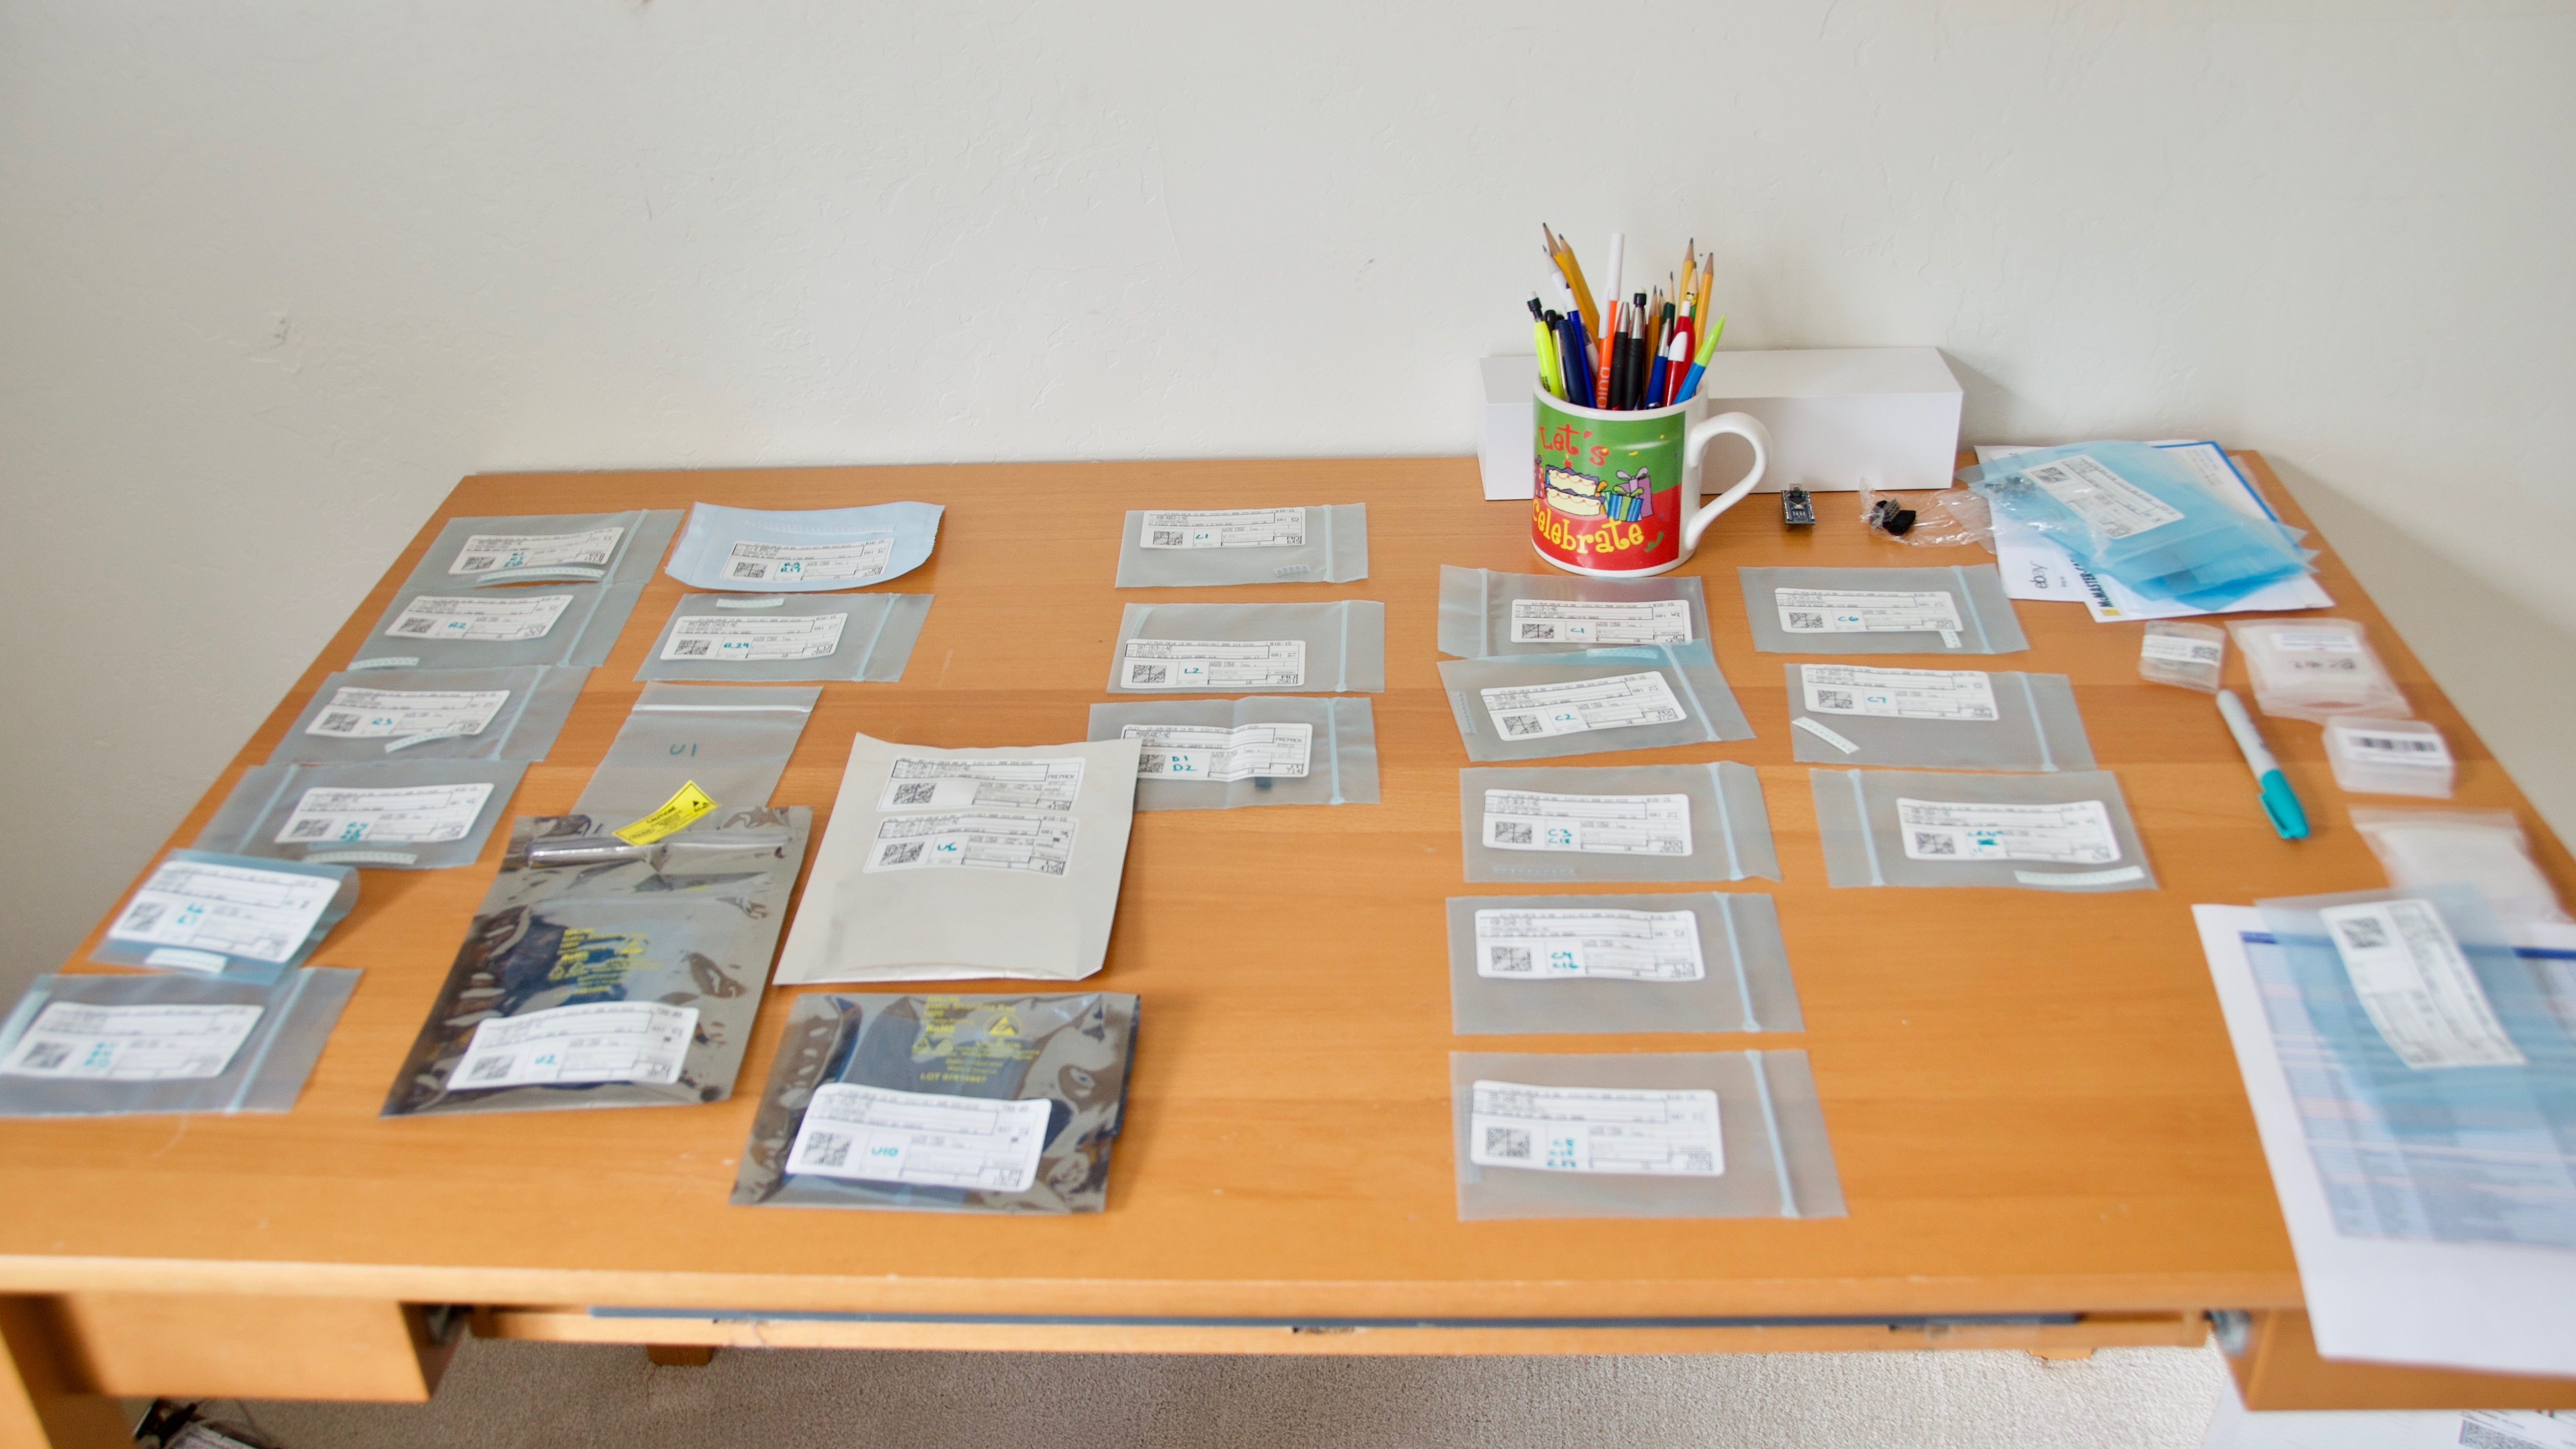
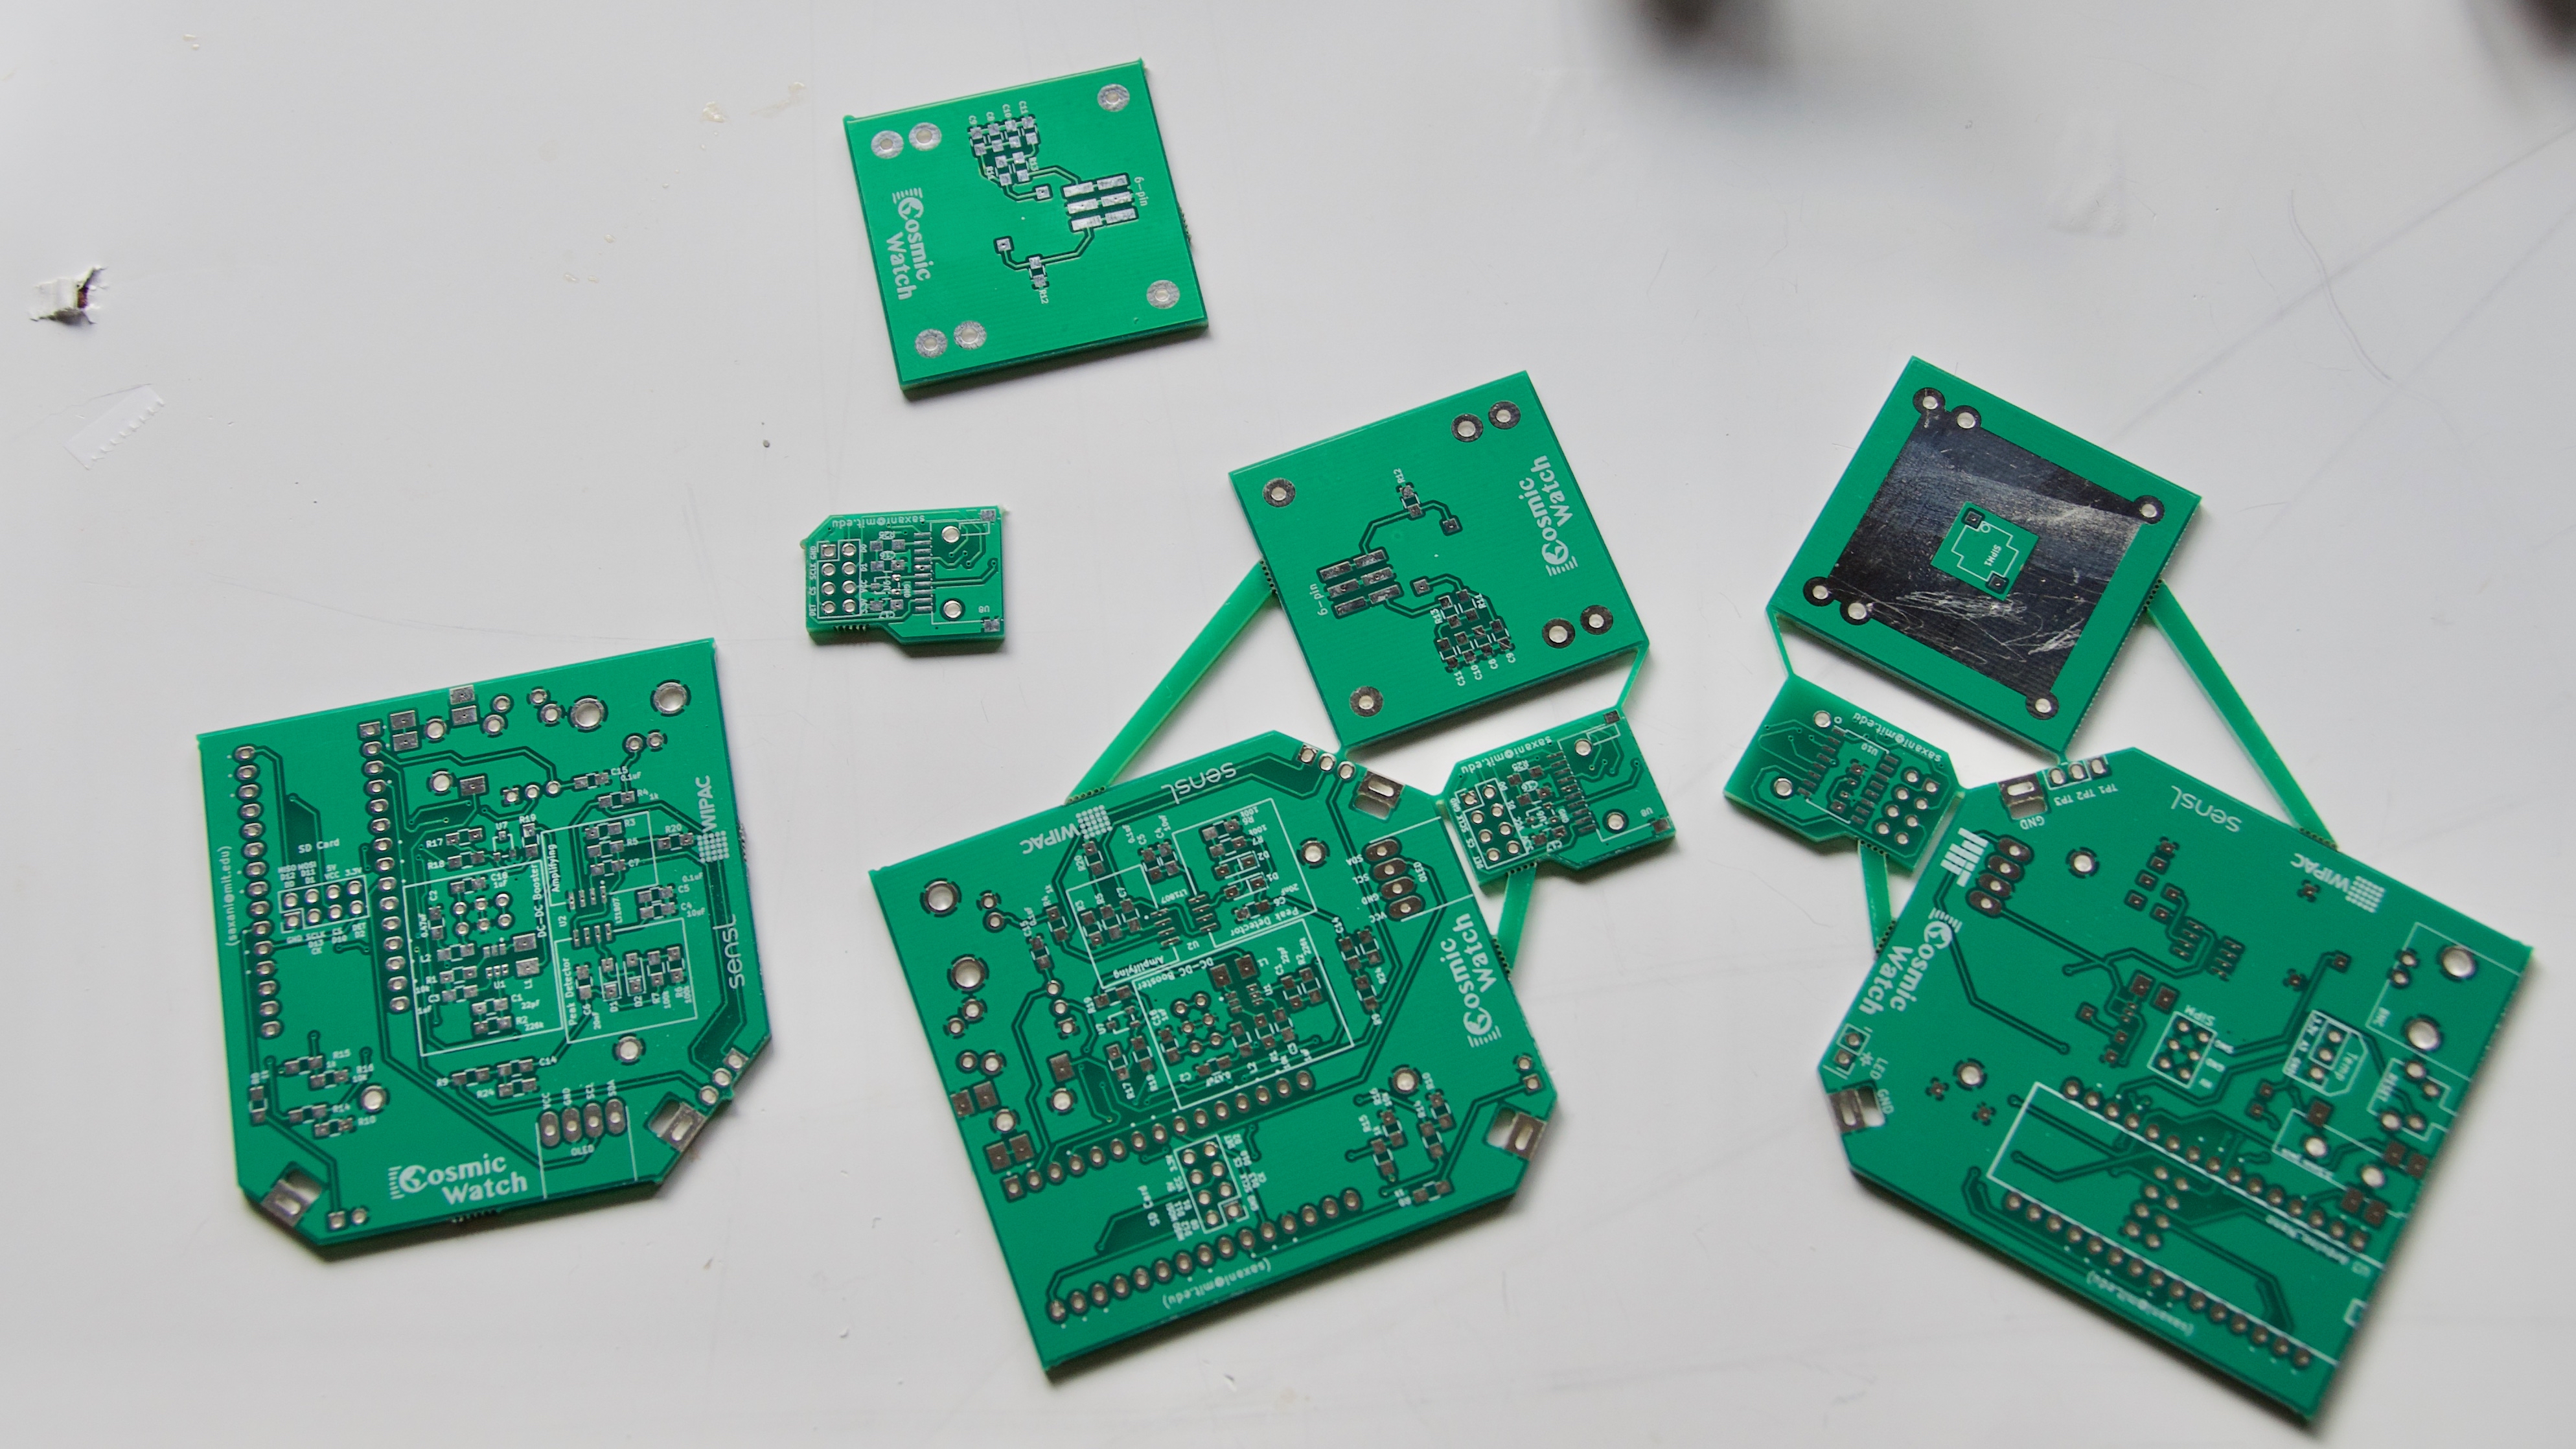
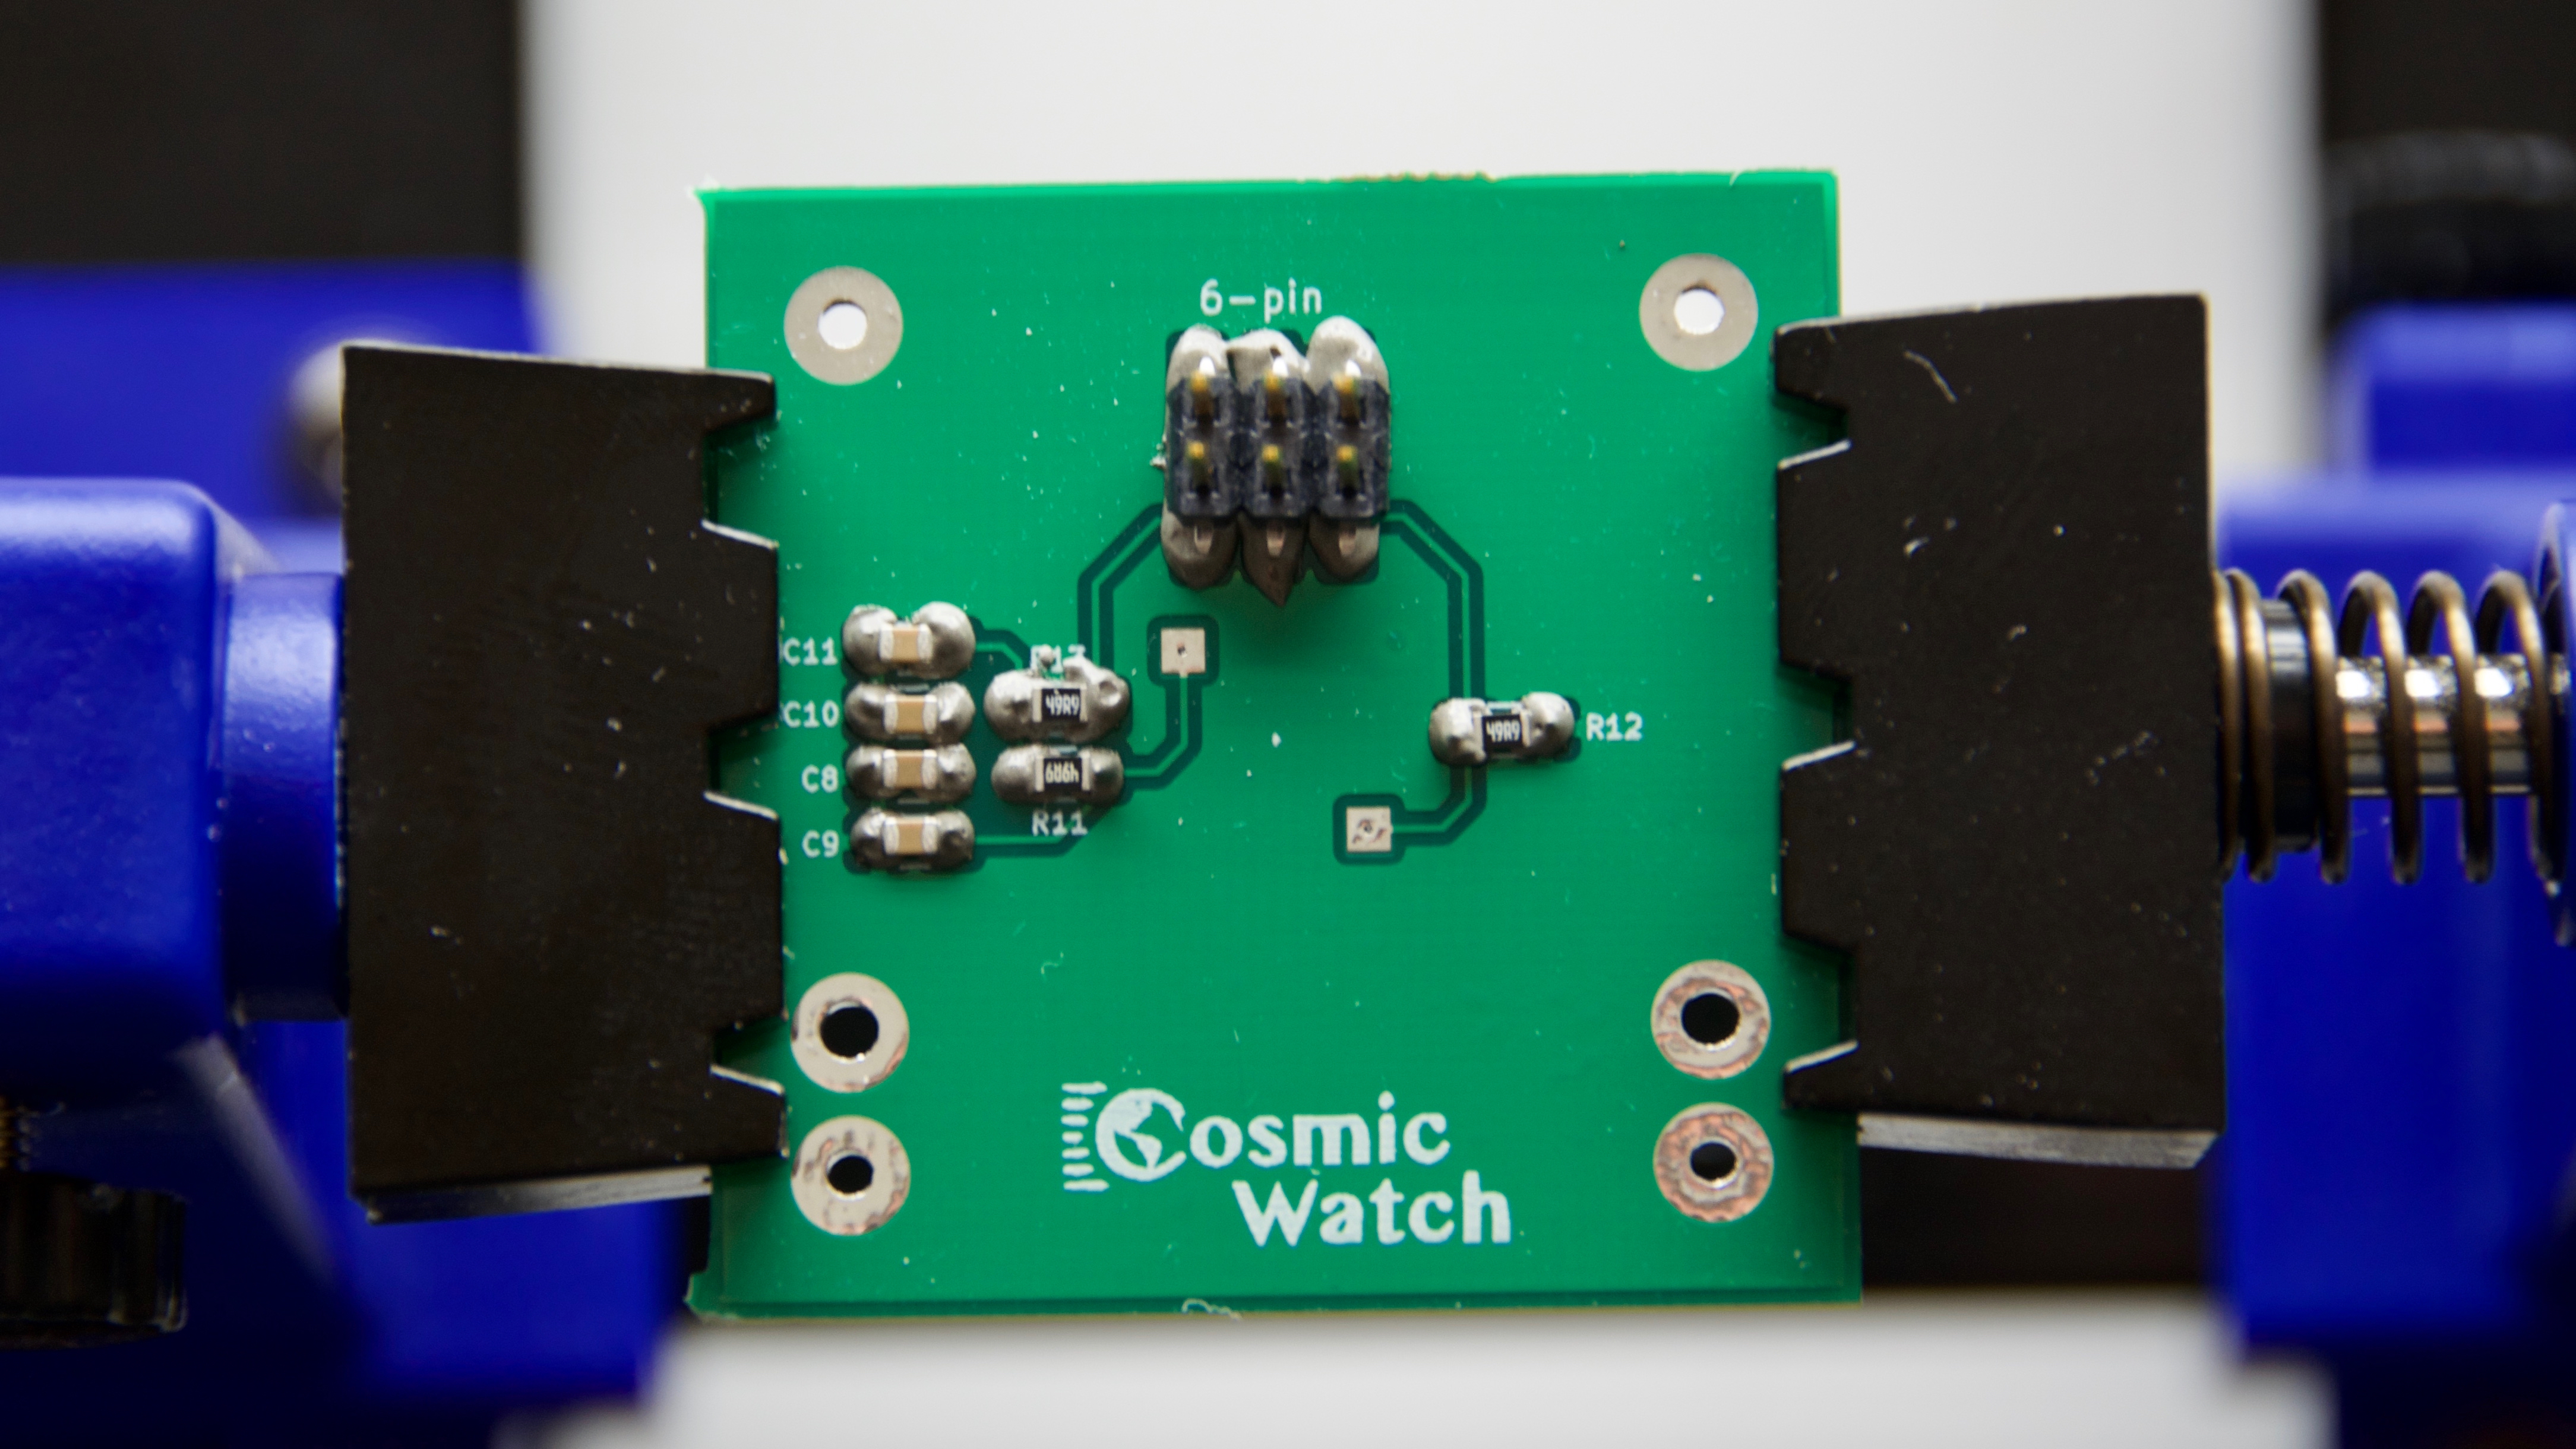
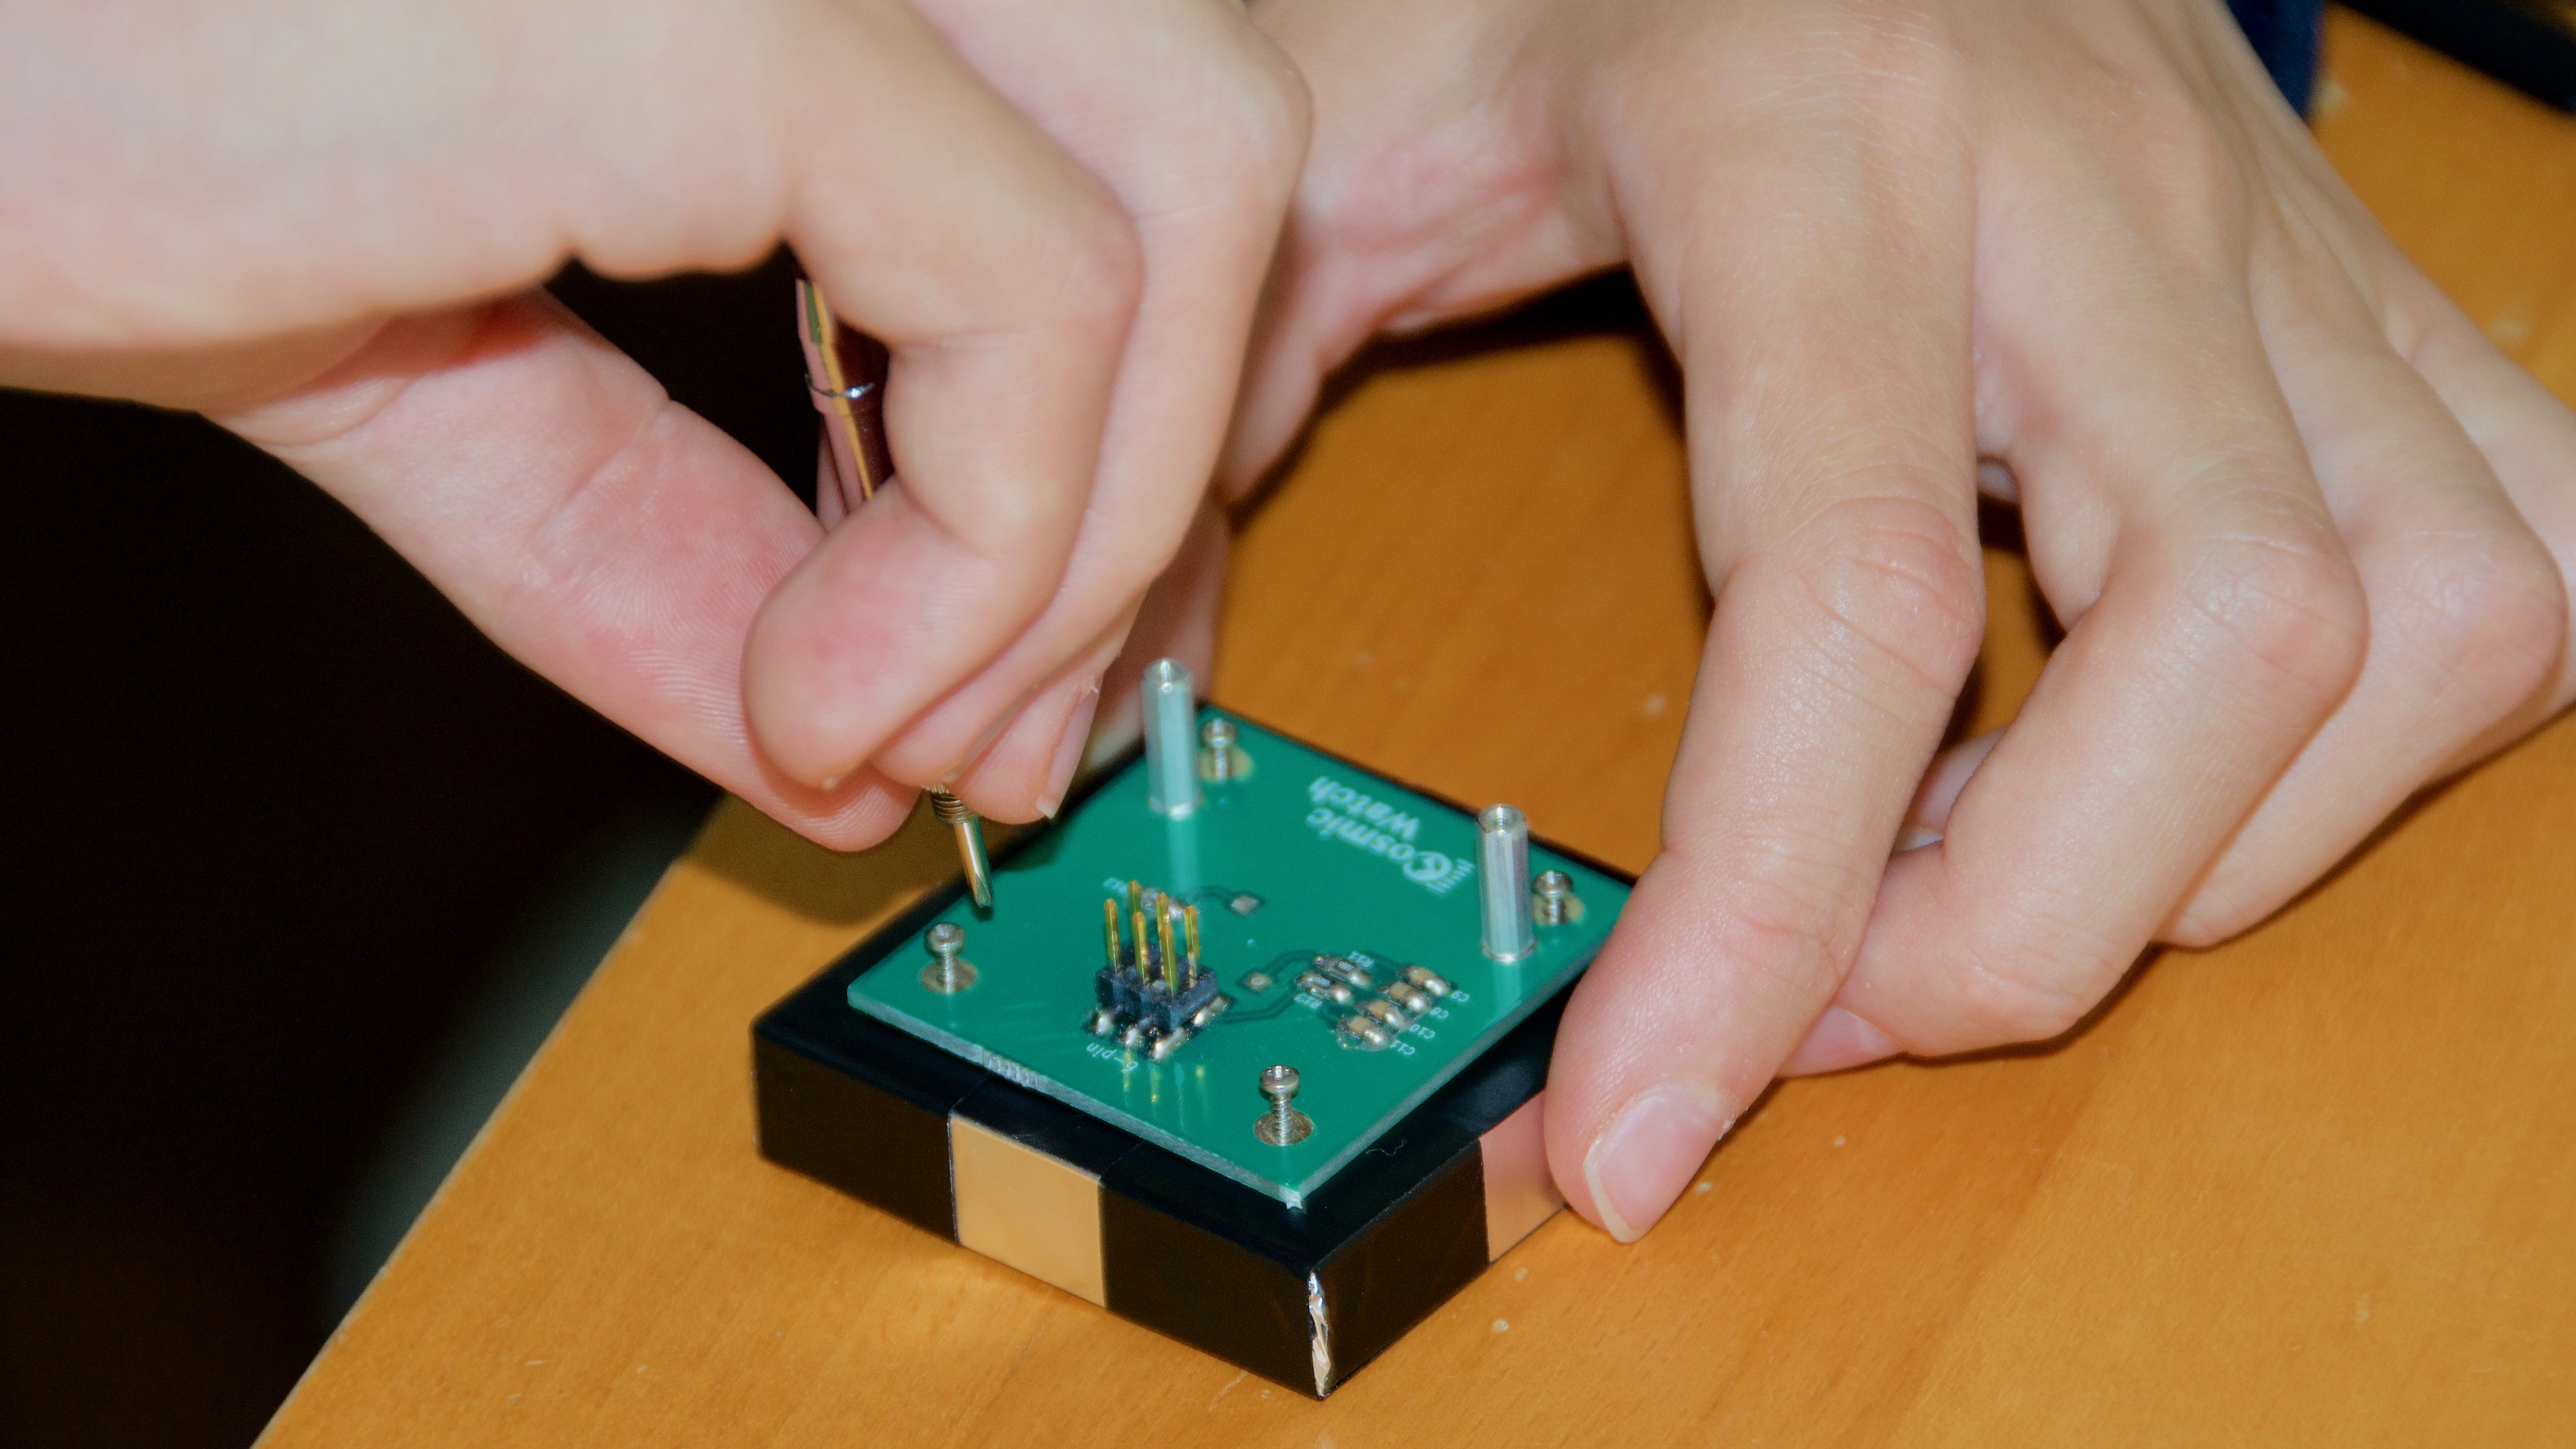
Solder all components onto the Main PCB and SD card PCB.
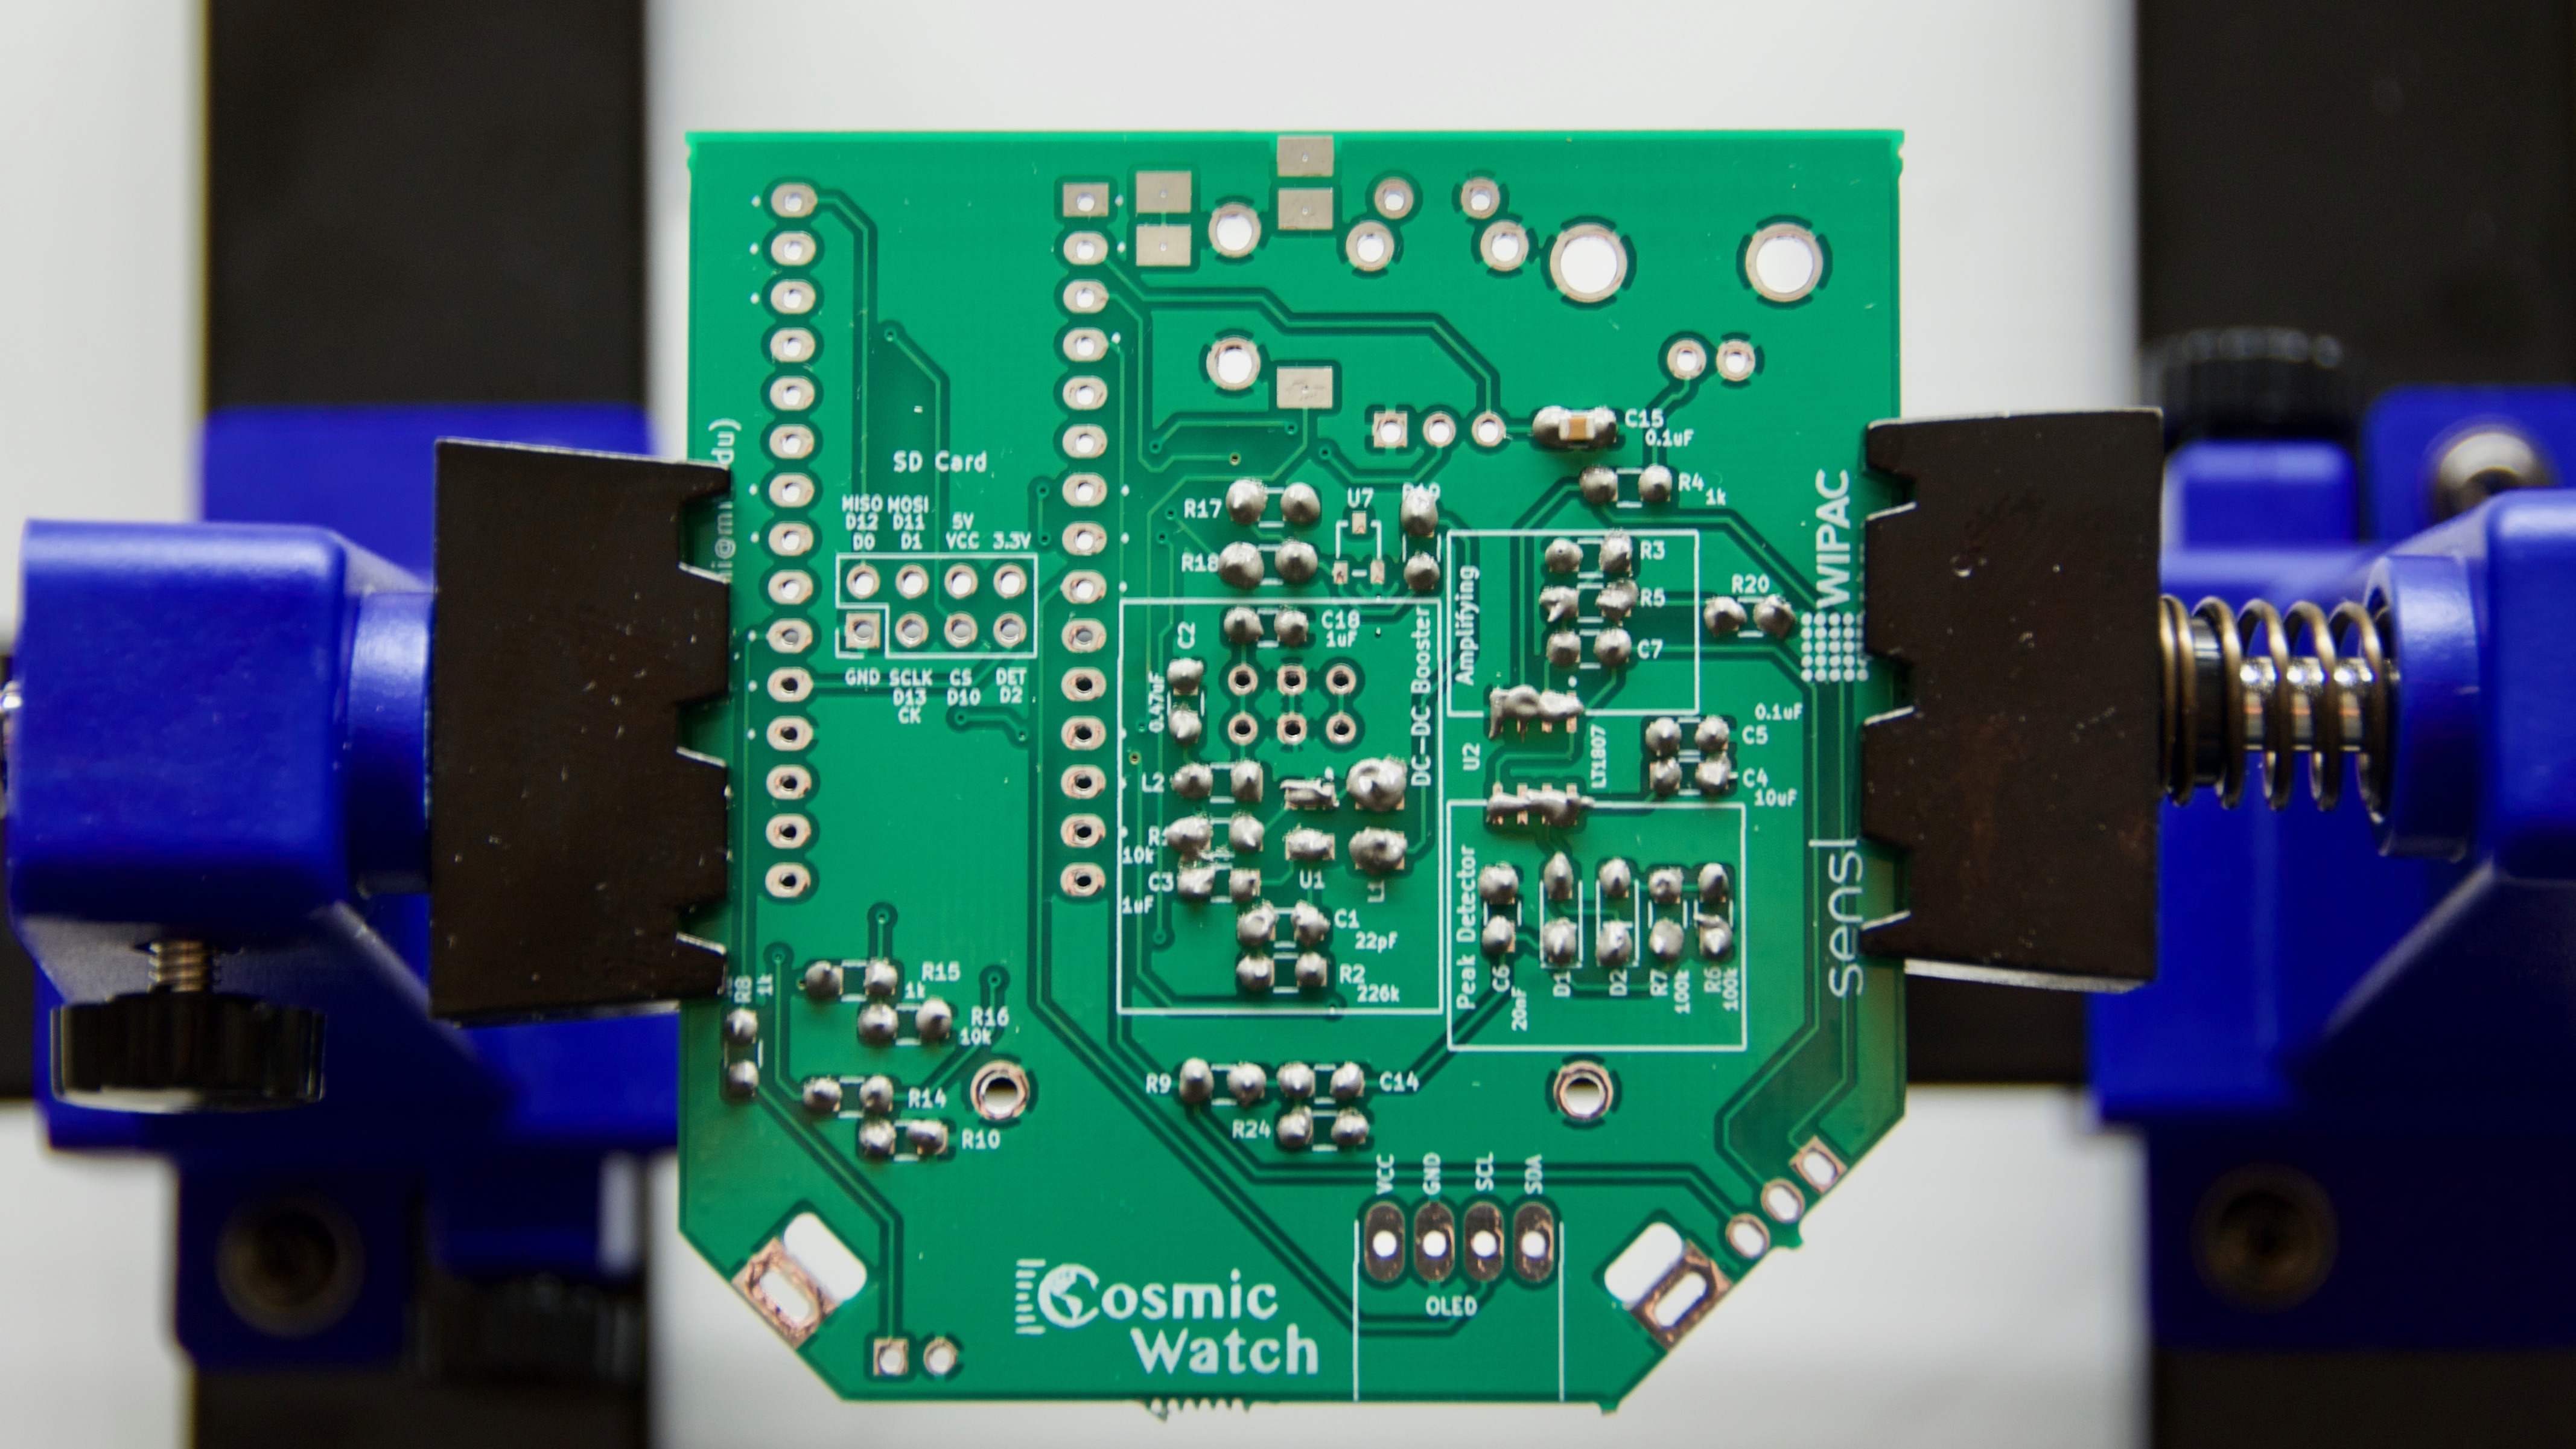
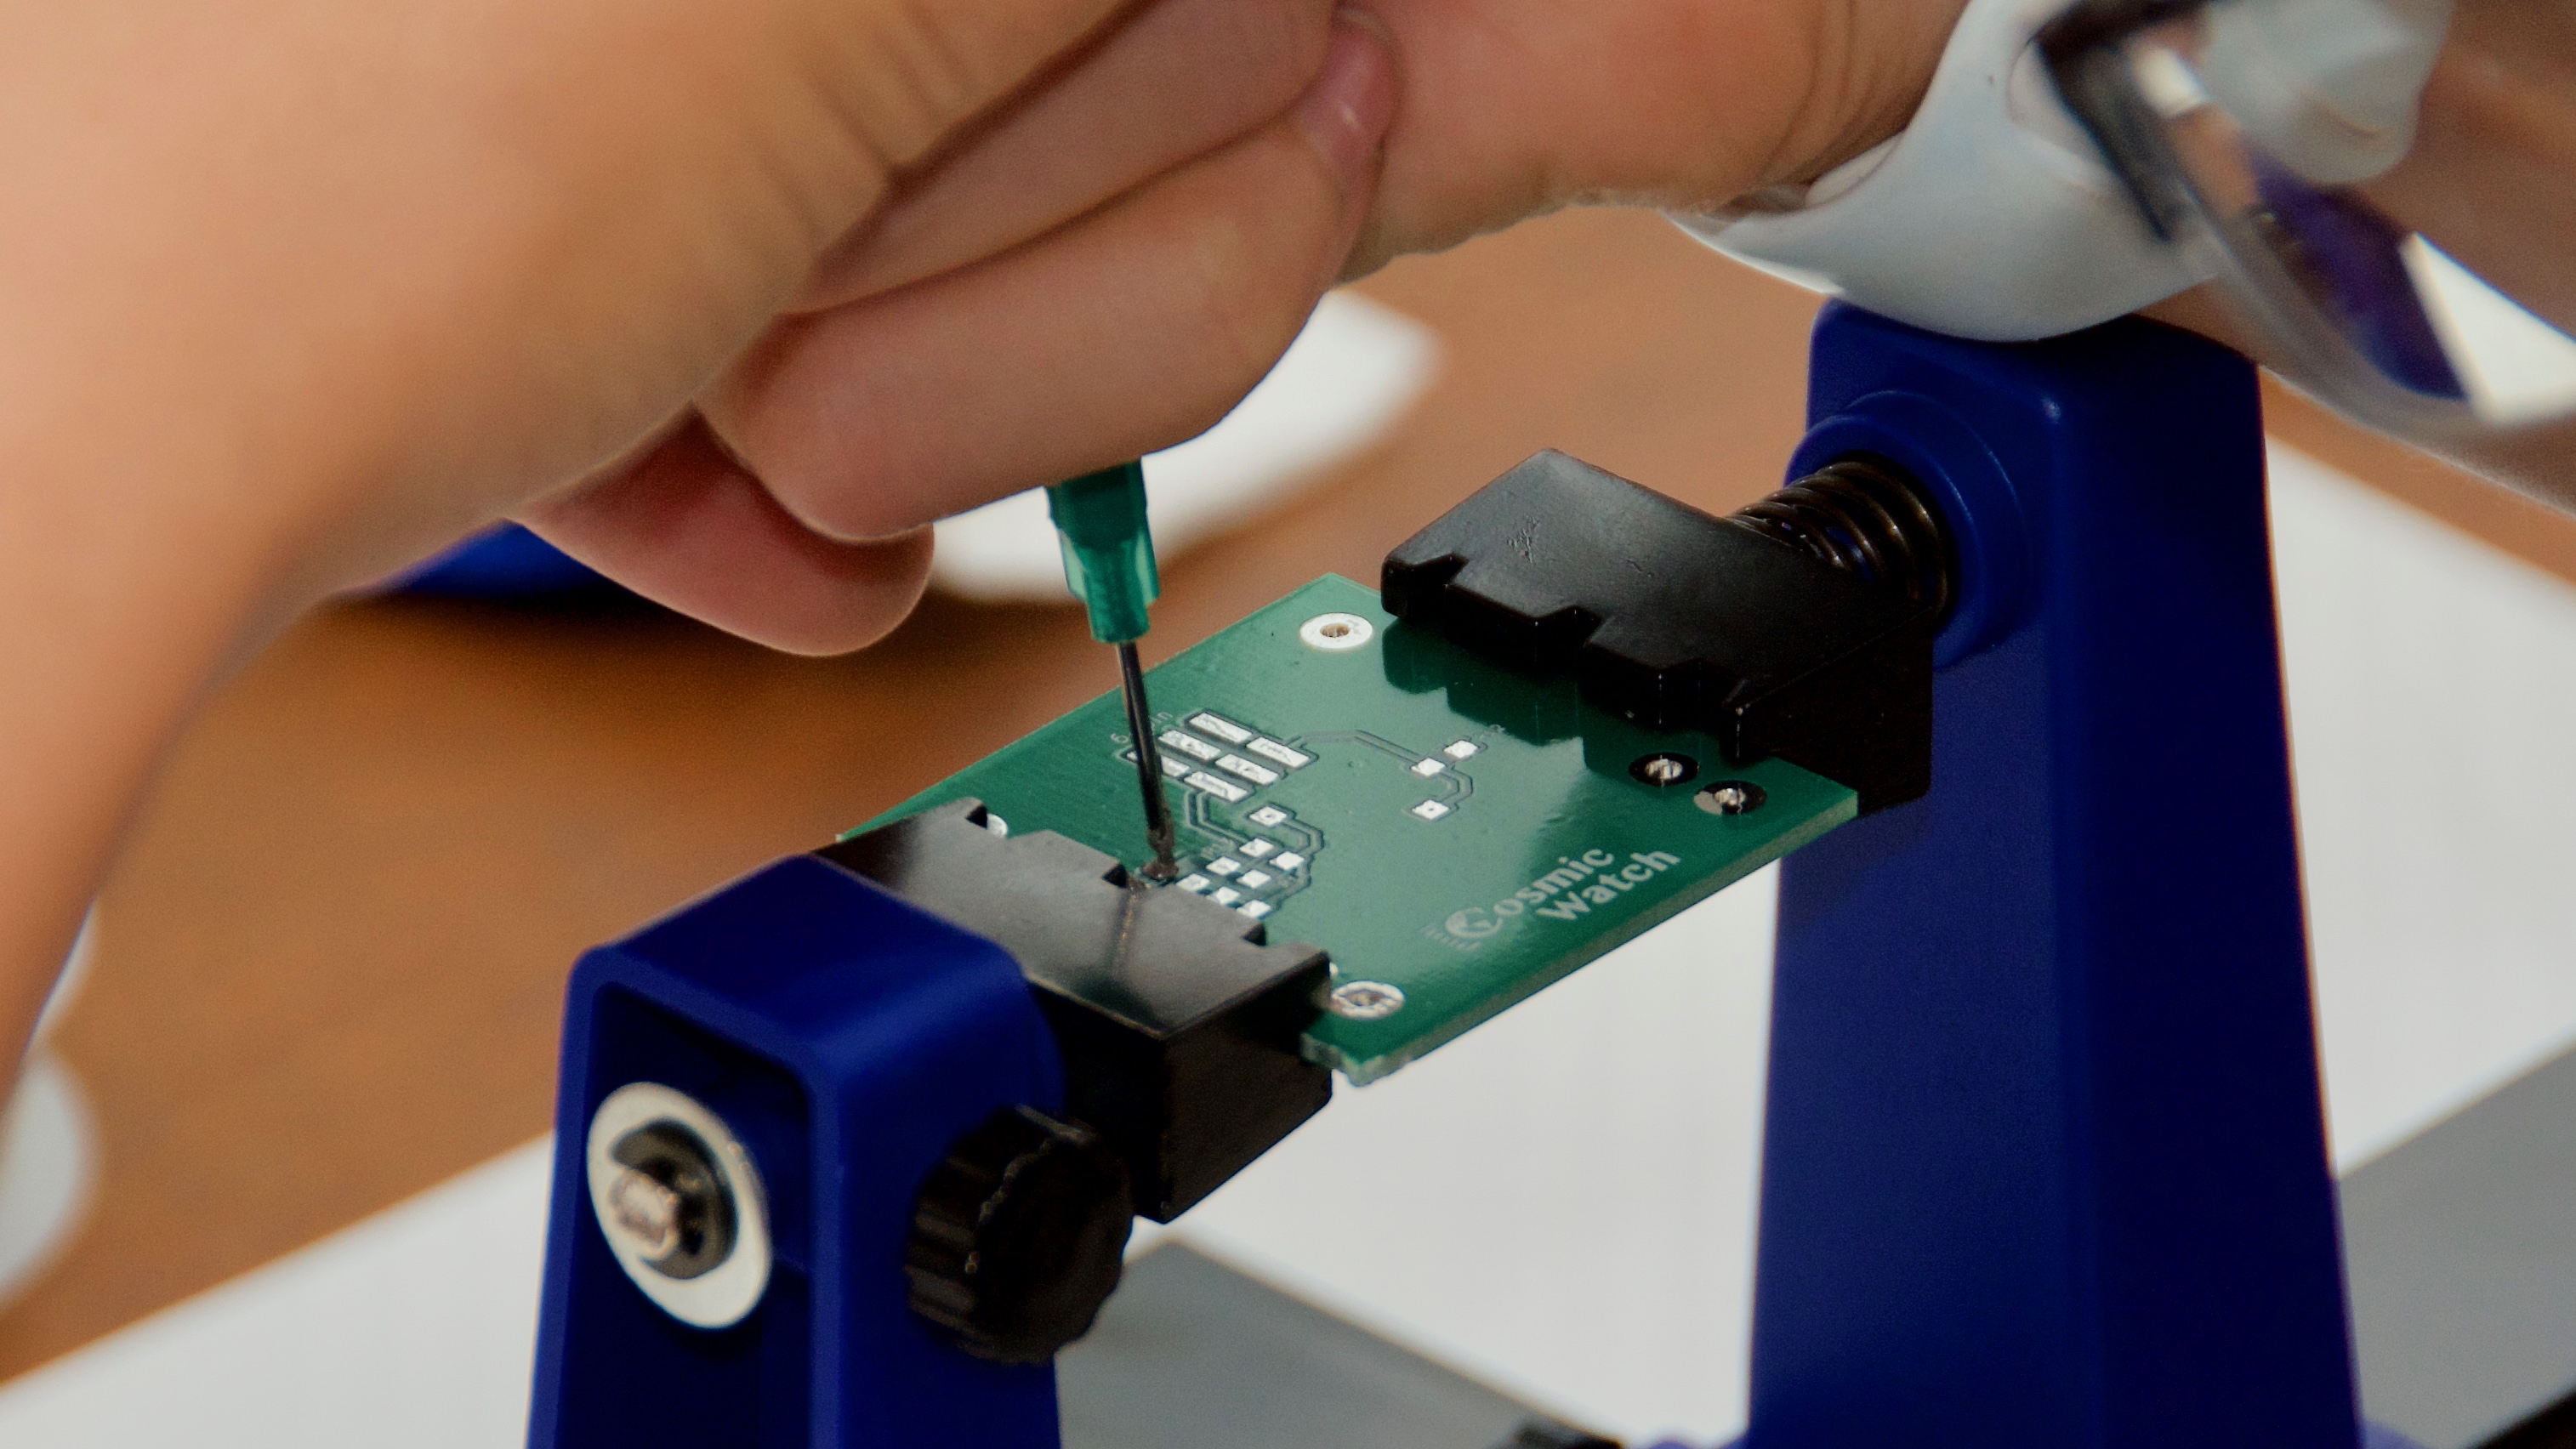
Ensure that Main PCB is delivering approximately +29.5 V through HV pin.
- Solder components onto the SiPM PCB.
- Cut scintillator to 5 x 5 x 1 cm. Drill four holes for the mounting of the SiPM PCB.
- Wrap scintillator in reflective foil.
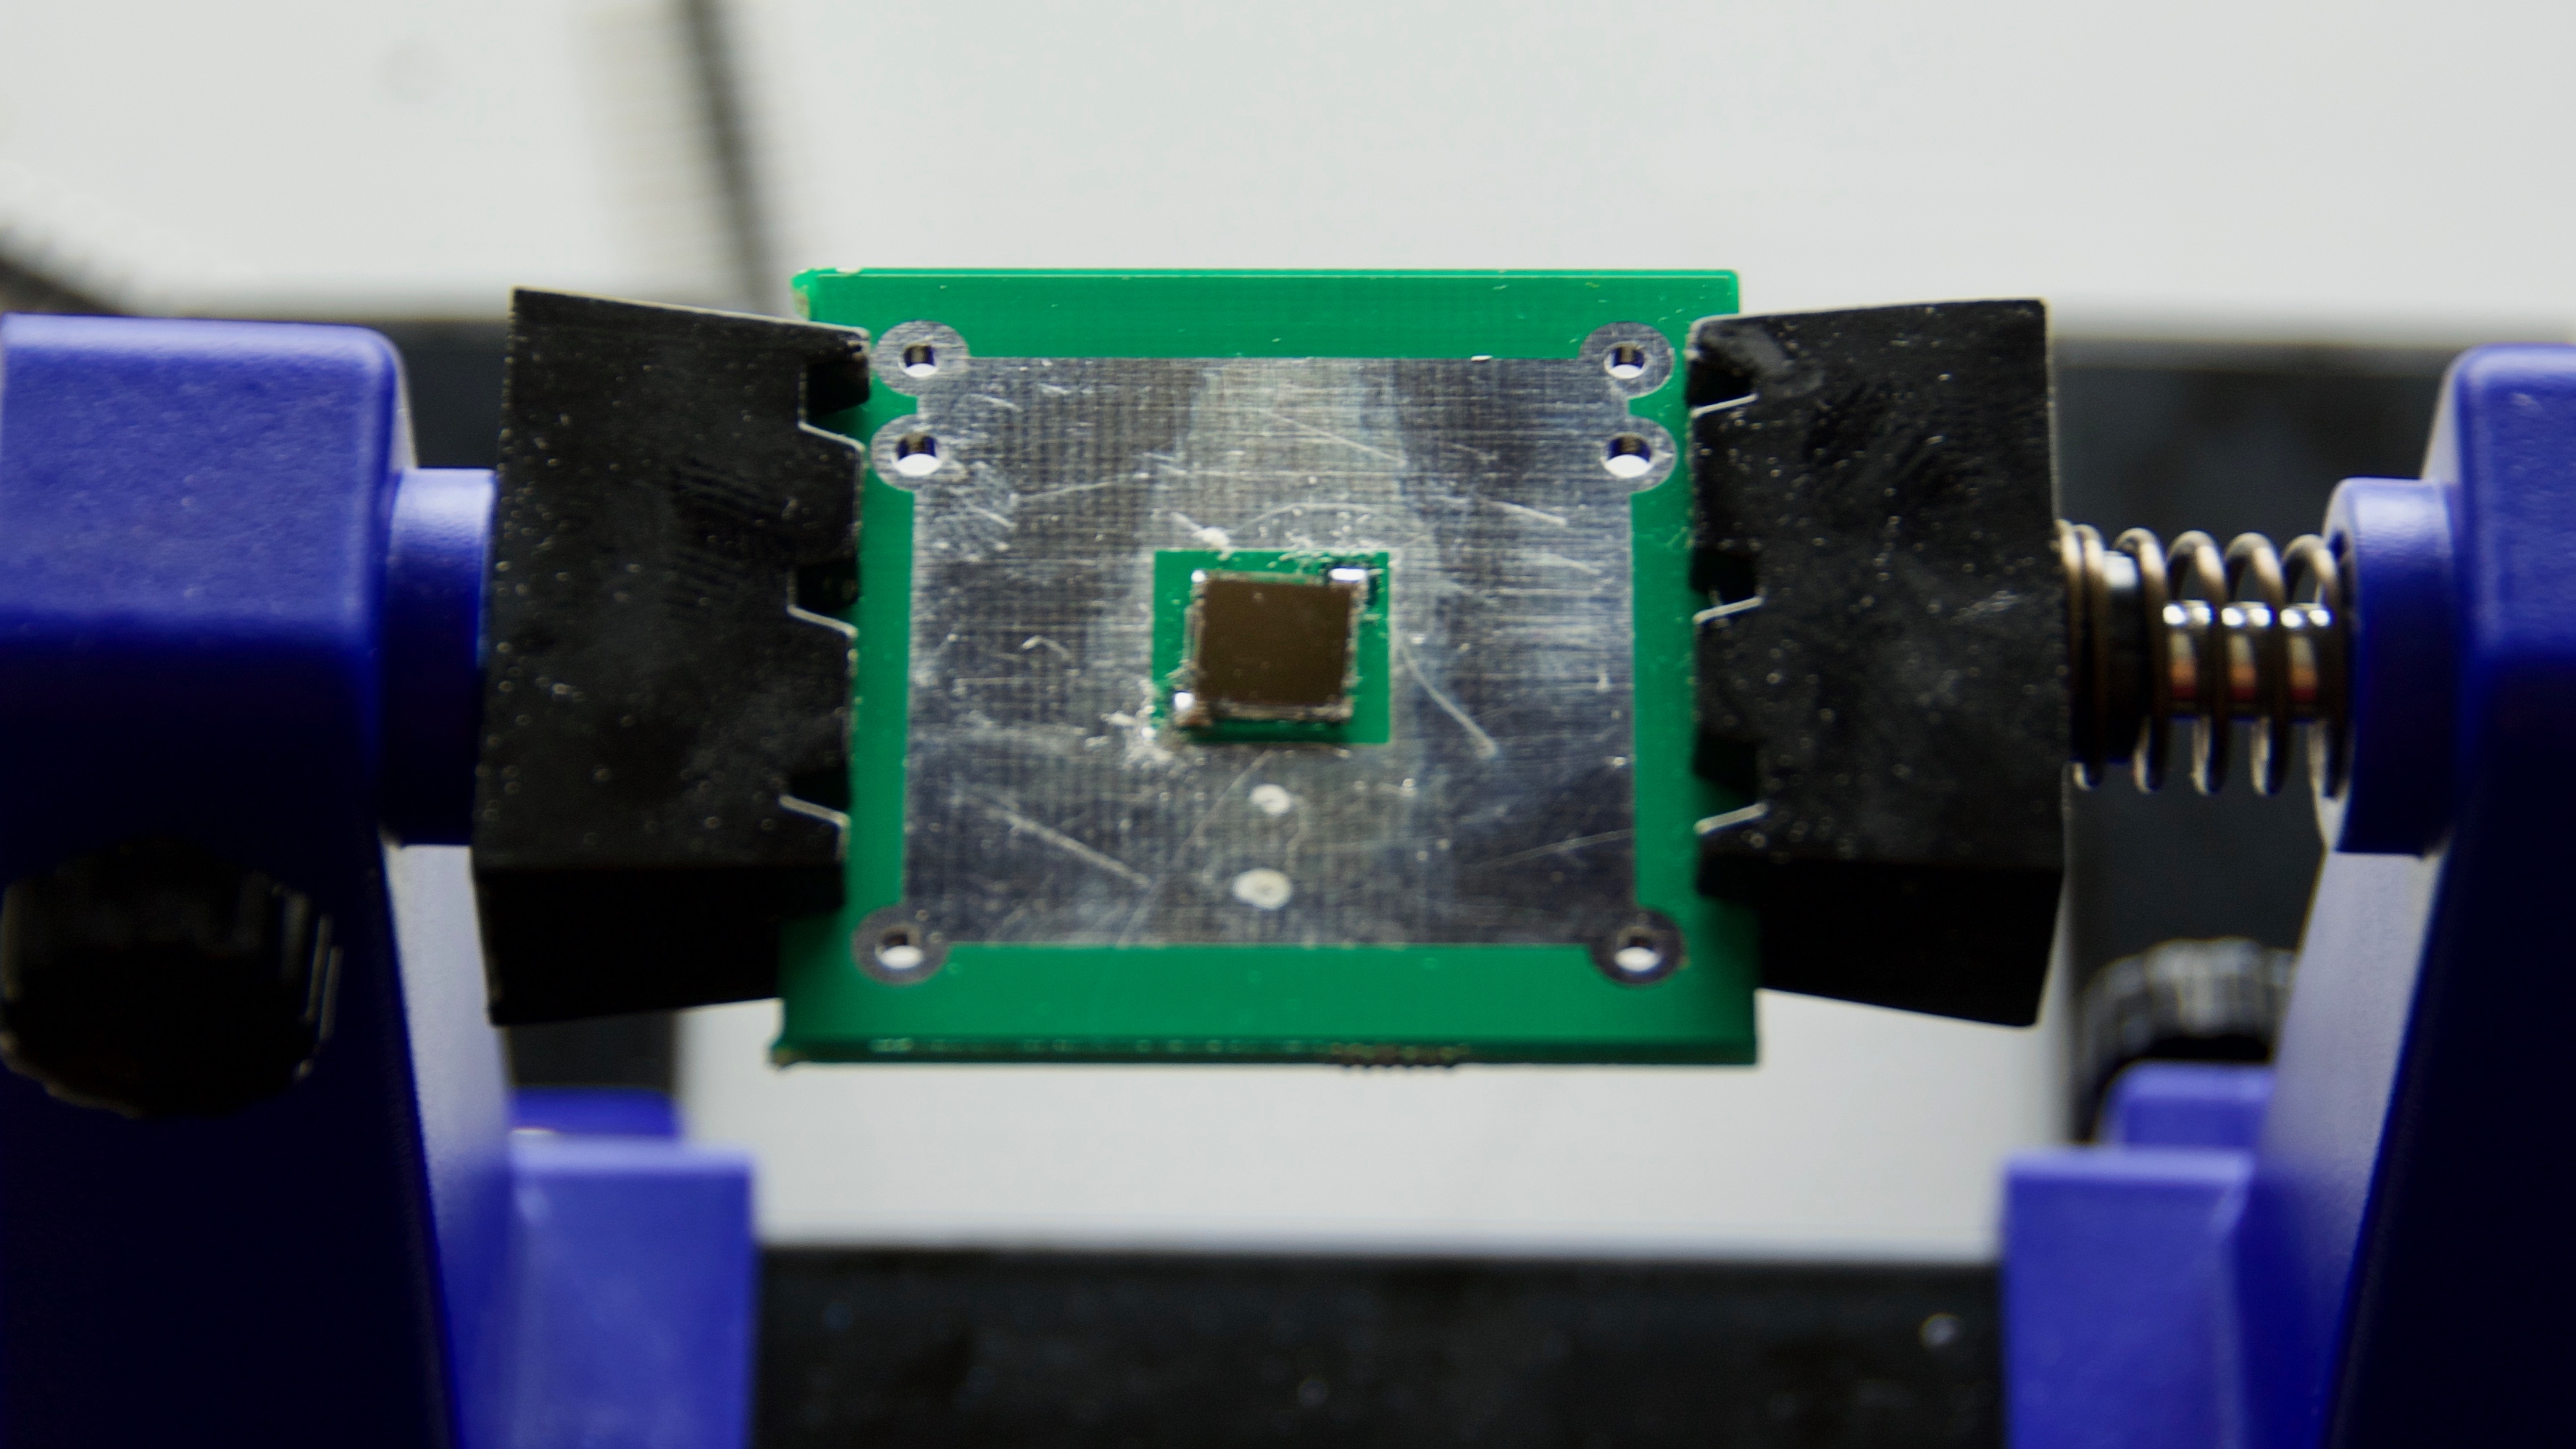
- Put optical gel on SiPM and screw SiPM PCB into the plastic scintillator.
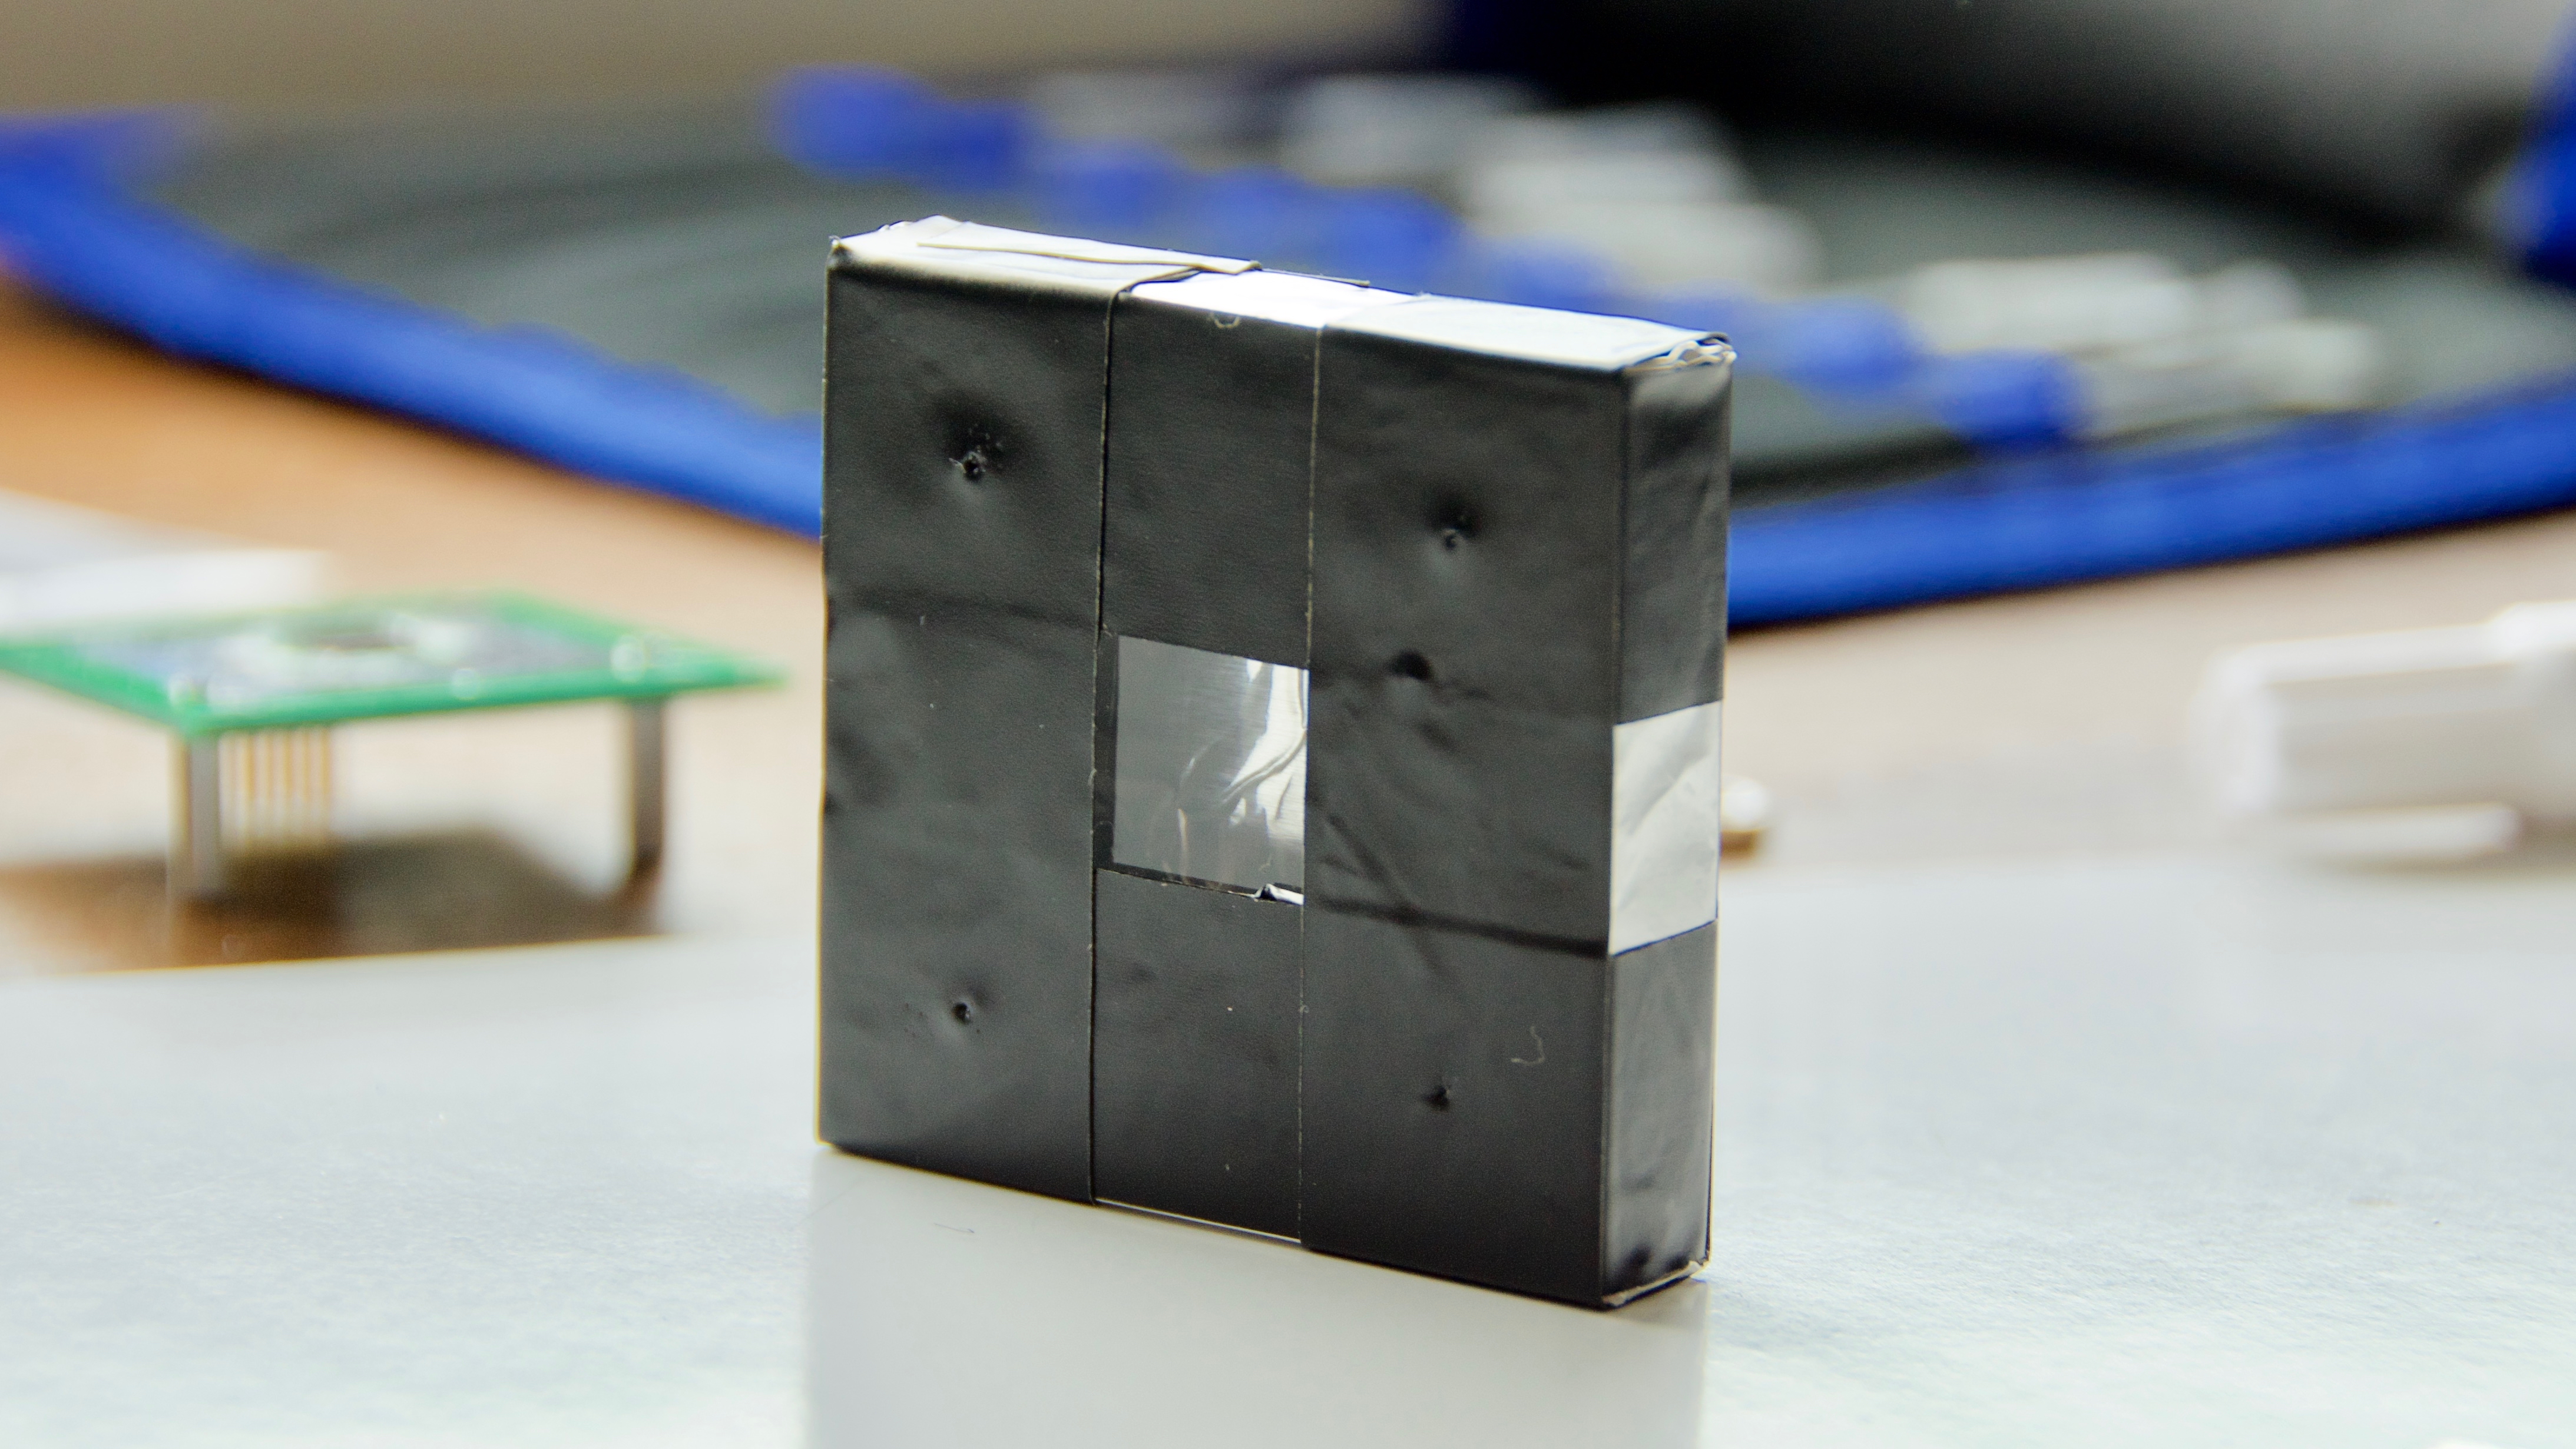
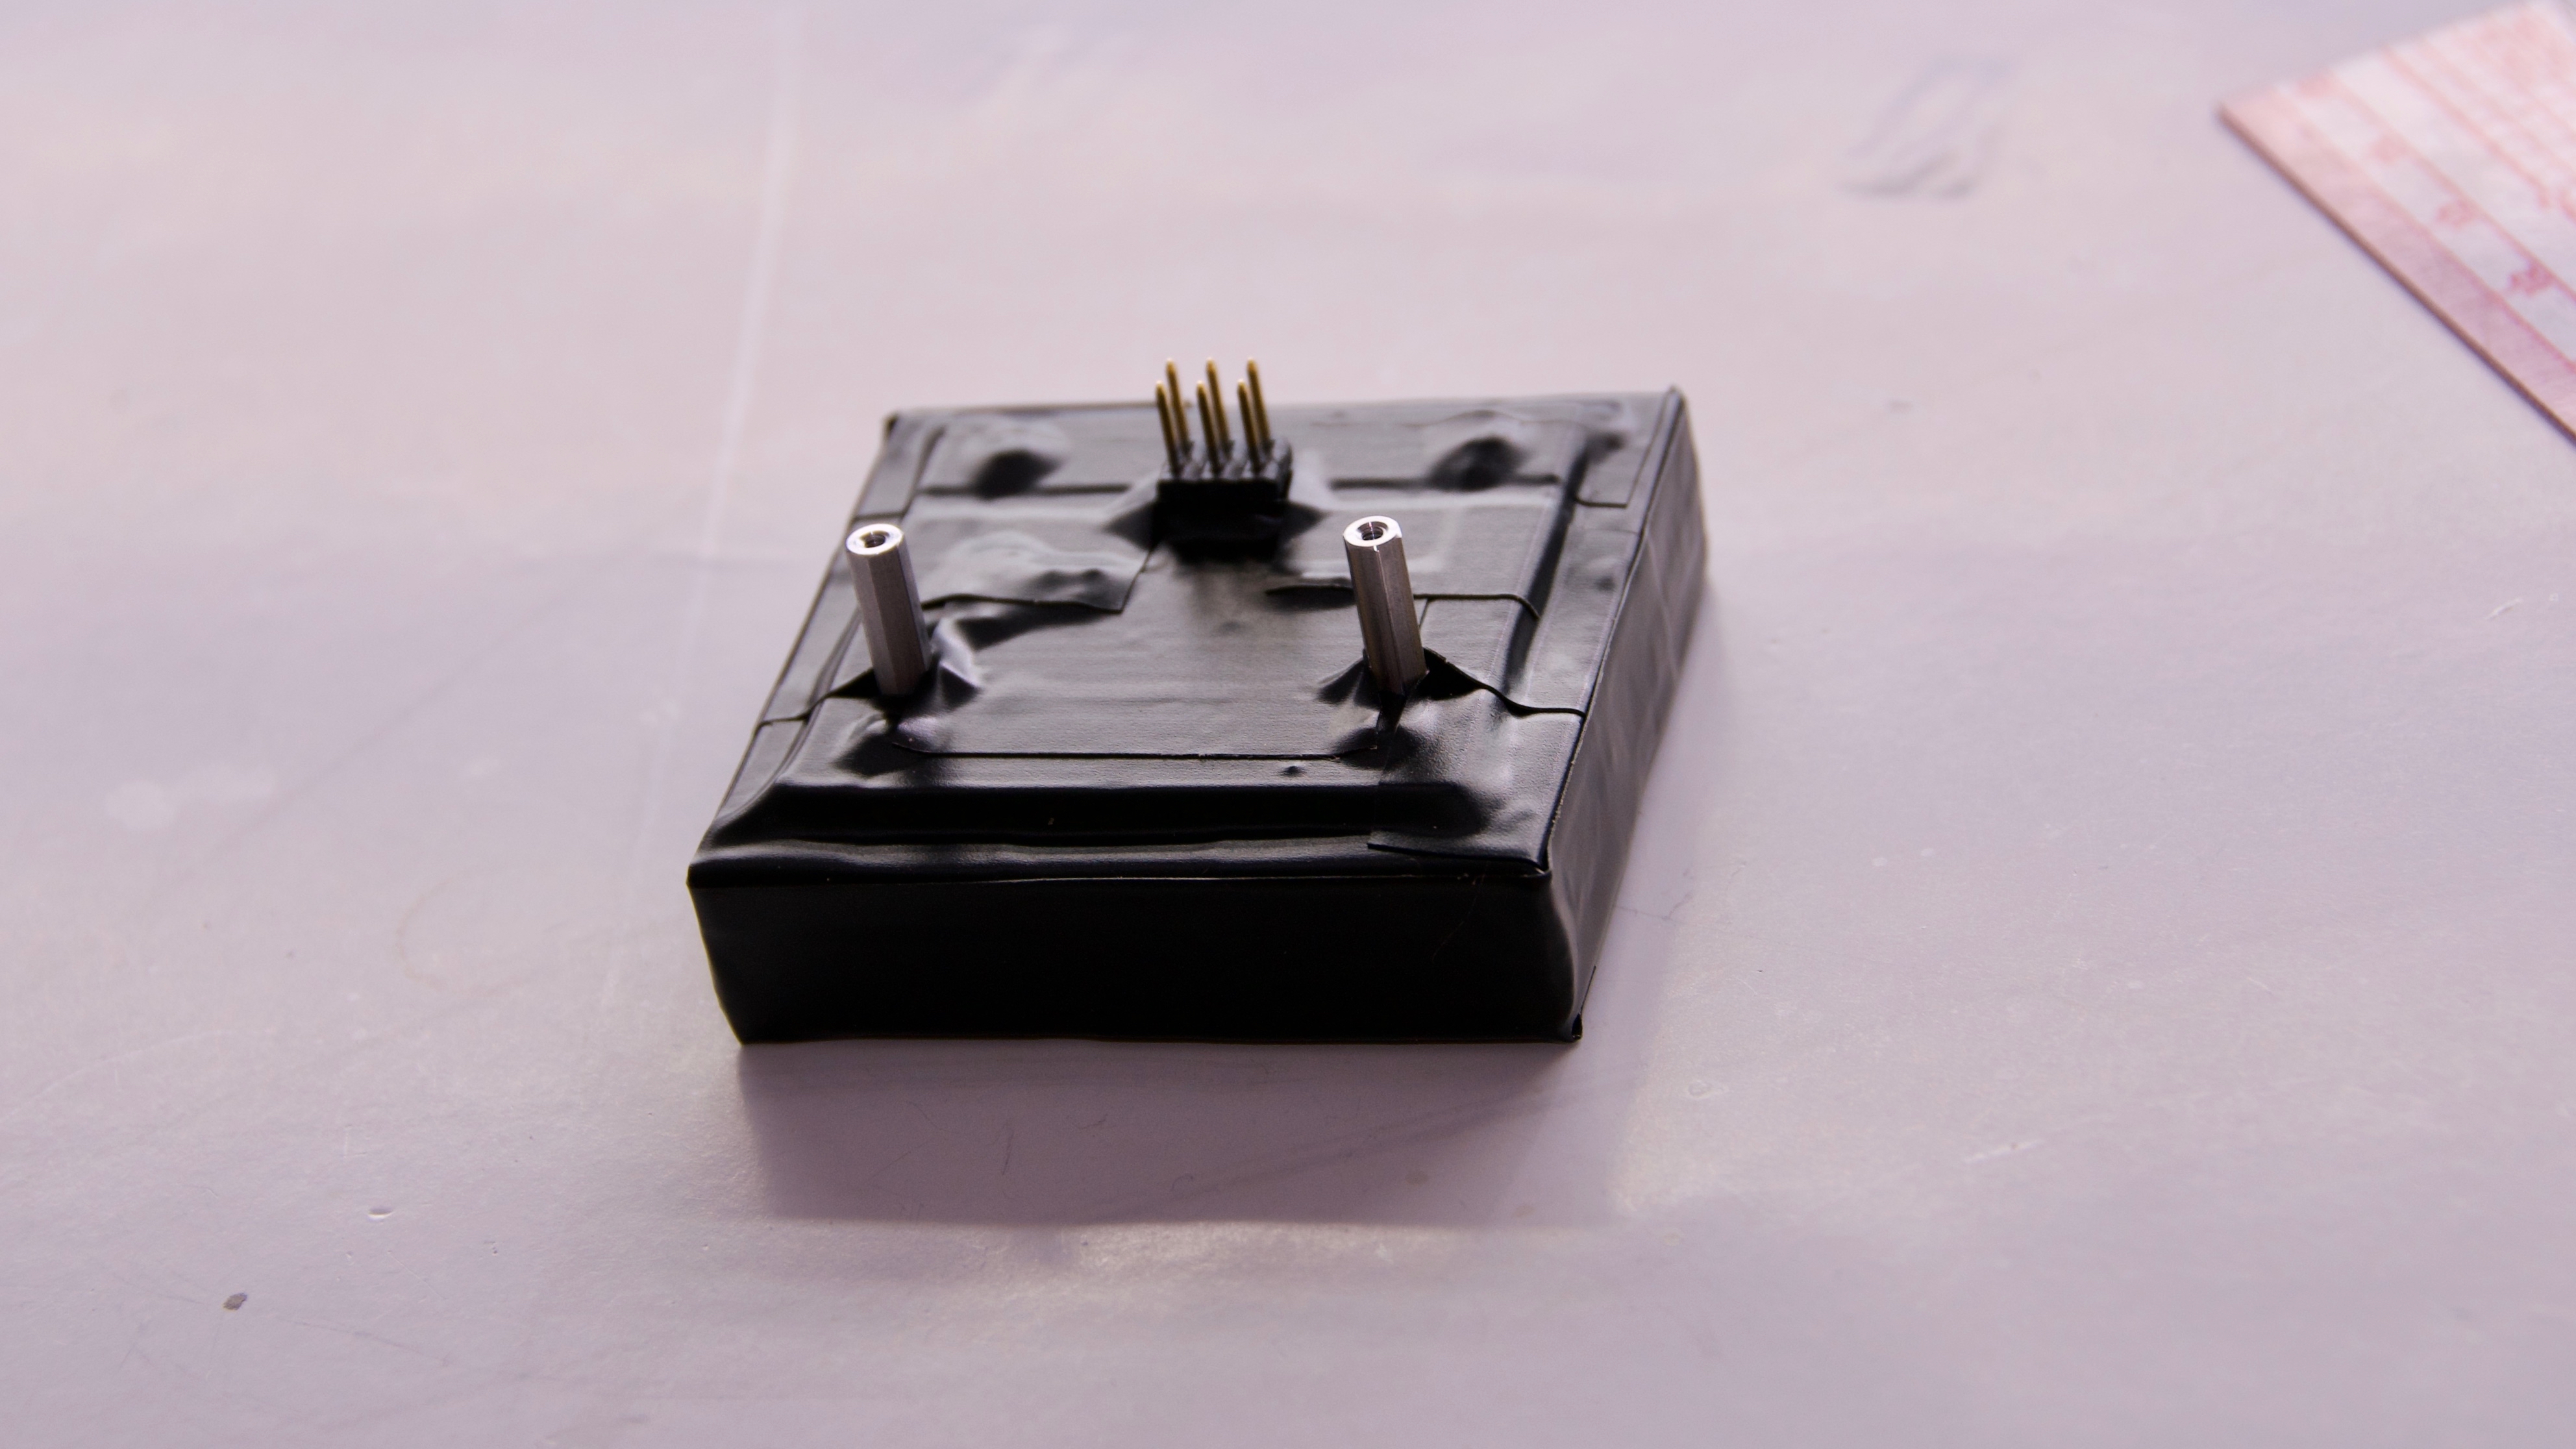
Wrap plastic scintillator and SiPM PCB with electrical tape, blocking all light from entering.
Solder the Arduino Nano to the Main PCB.
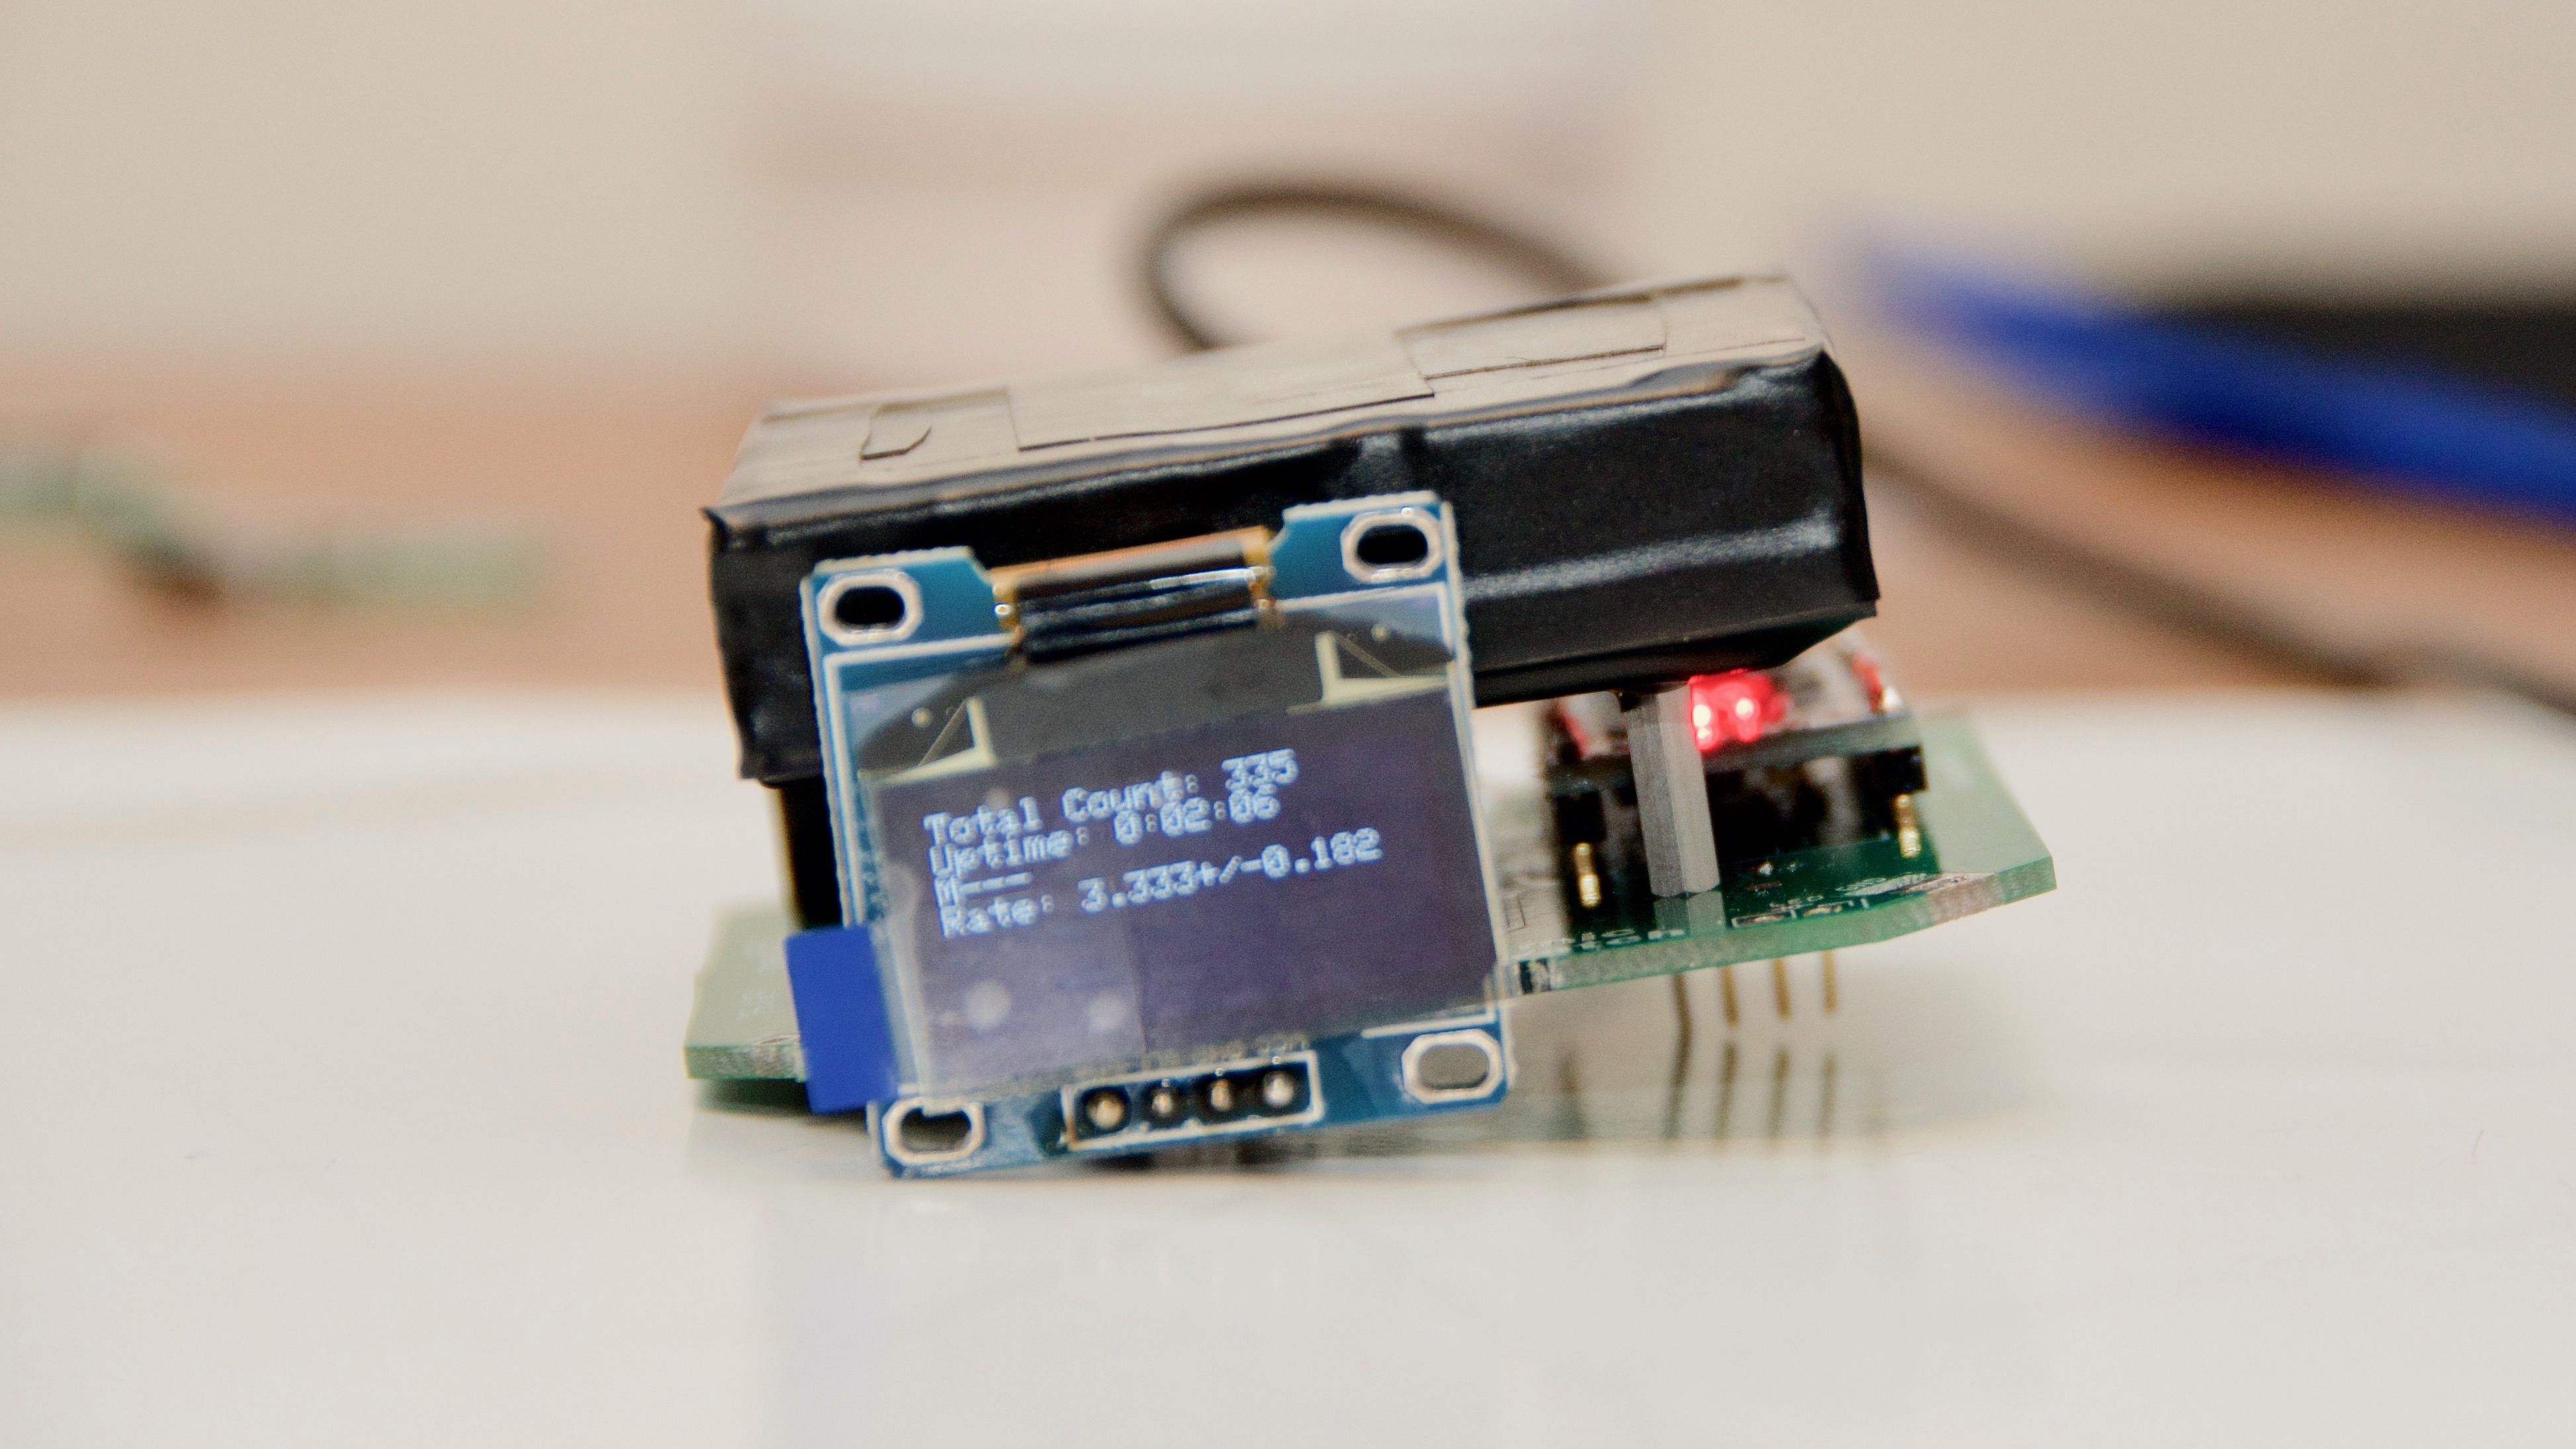
- Plug SiPM PCB into Main PCB. OLED display will show the rate
of pulses.
Experiment 1: Gamma Ray Spectrum
Objective
Evaluate the particle detector as a gamma ray spectrometer.
Materials
- Na radioactive source
- Particle detector
- Digilent Analog Discovery 2 oscilloscope
- Coaxial and probe cables
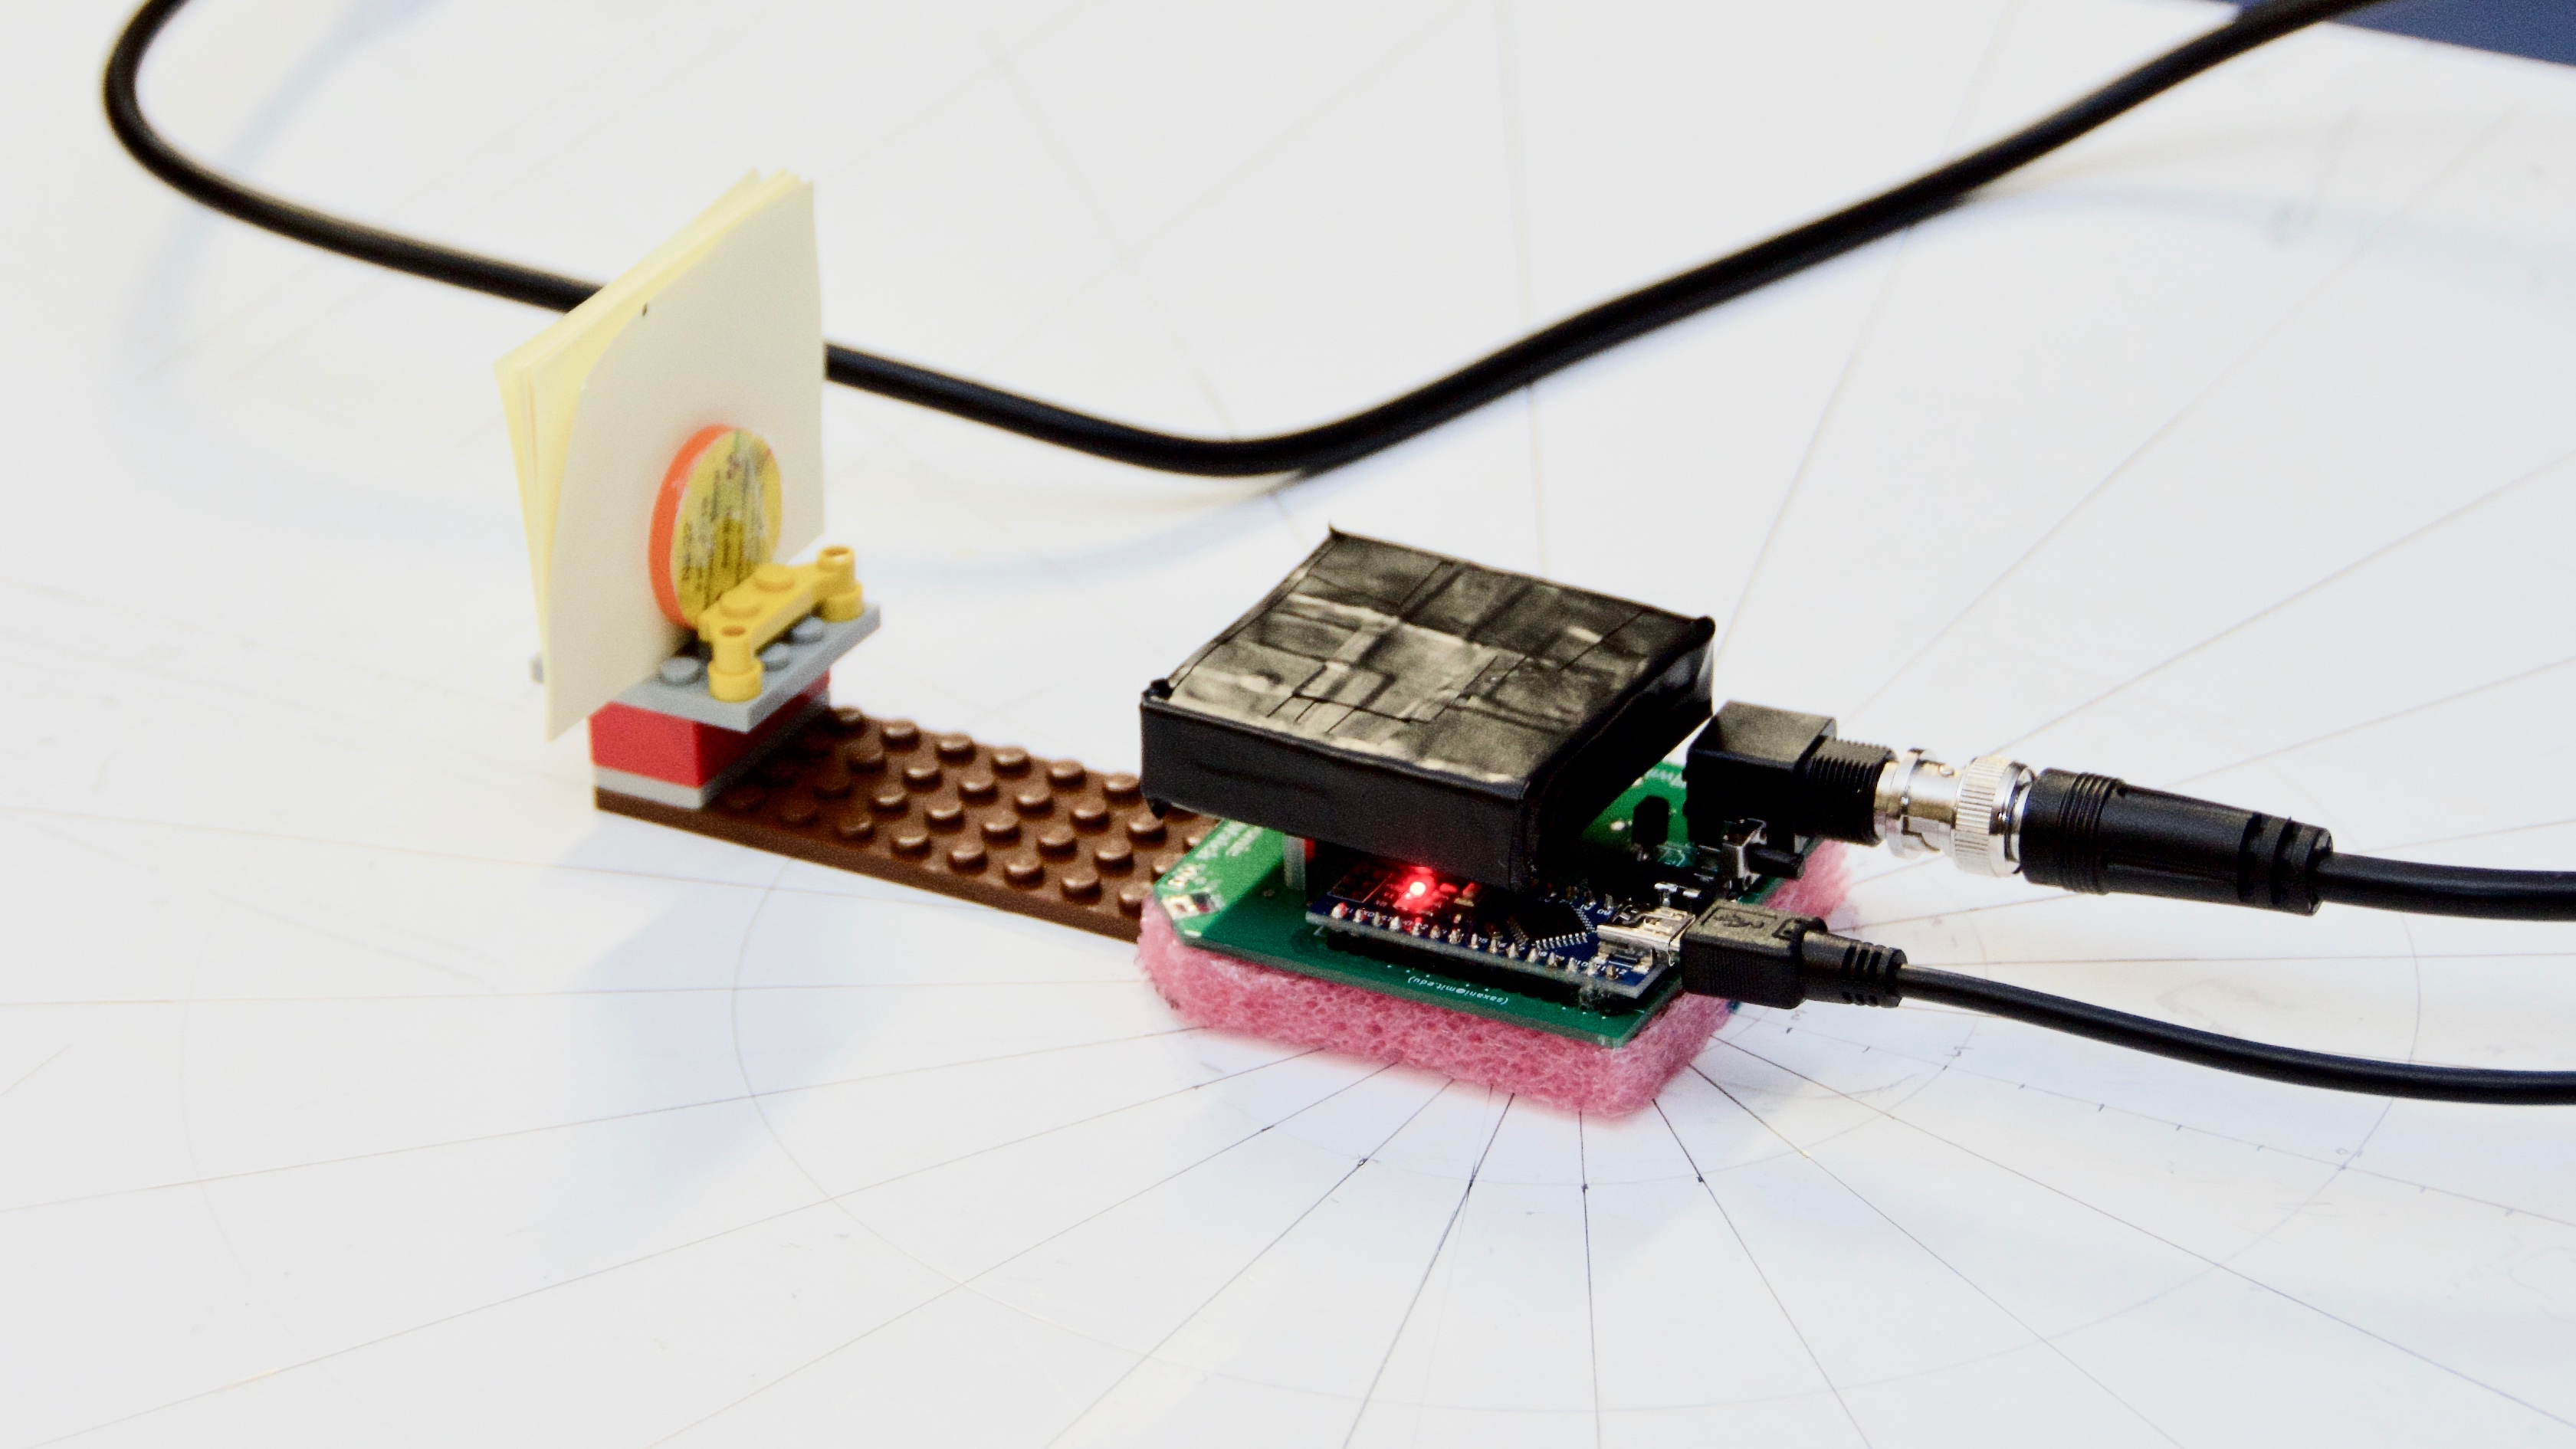 Figure 6: Experimental Setup
Approach
- Place radioactive source at constant position.
- Connect oscilloscope to particle detector via coaxial cables or to amplified port. Record signal for two hours.
- Repeat same procedure recording signals as reported from the Arduino.
- Remove radioactive source and measure rates again for 22 hours.
- Use tools from dwf-tools to create graph that shows how the rate varies with particle energy.
Description
Each time a high-energy particle hits the plastic scintillator, it emits light which is converted into voltage by the silicon photomultiplier (SiPM). The particle detector amplifies this pulse. It also makes it longer so that the Arduino can detect it. The pulse can be measured in three ways however: Pulse as produced by the SiPM (via coaxial cable), the amplified pulse, and the pulse as detected from the Arduino code. To read the voltage in the first two methods, I used the oscilloscope and the dwf-tools software. For the third way, the information is readable from the Arduino, so the oscilloscope is not needed. I wanted to compare the rates of the radioactive source and background radiation.
Results
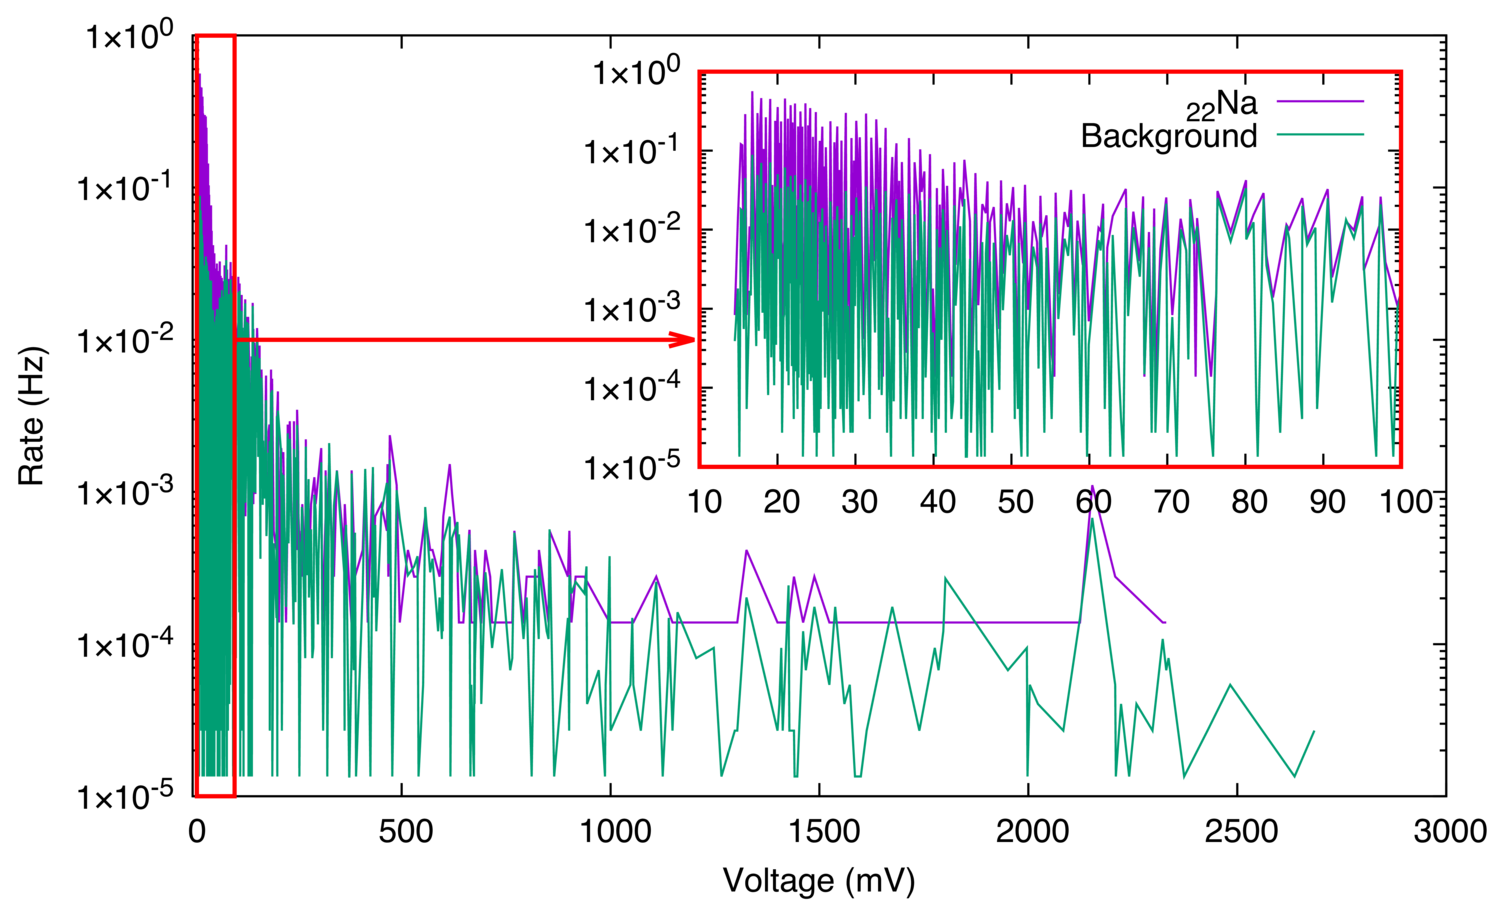 Figure 7: Na gamma ray spectrum from the Arduino.
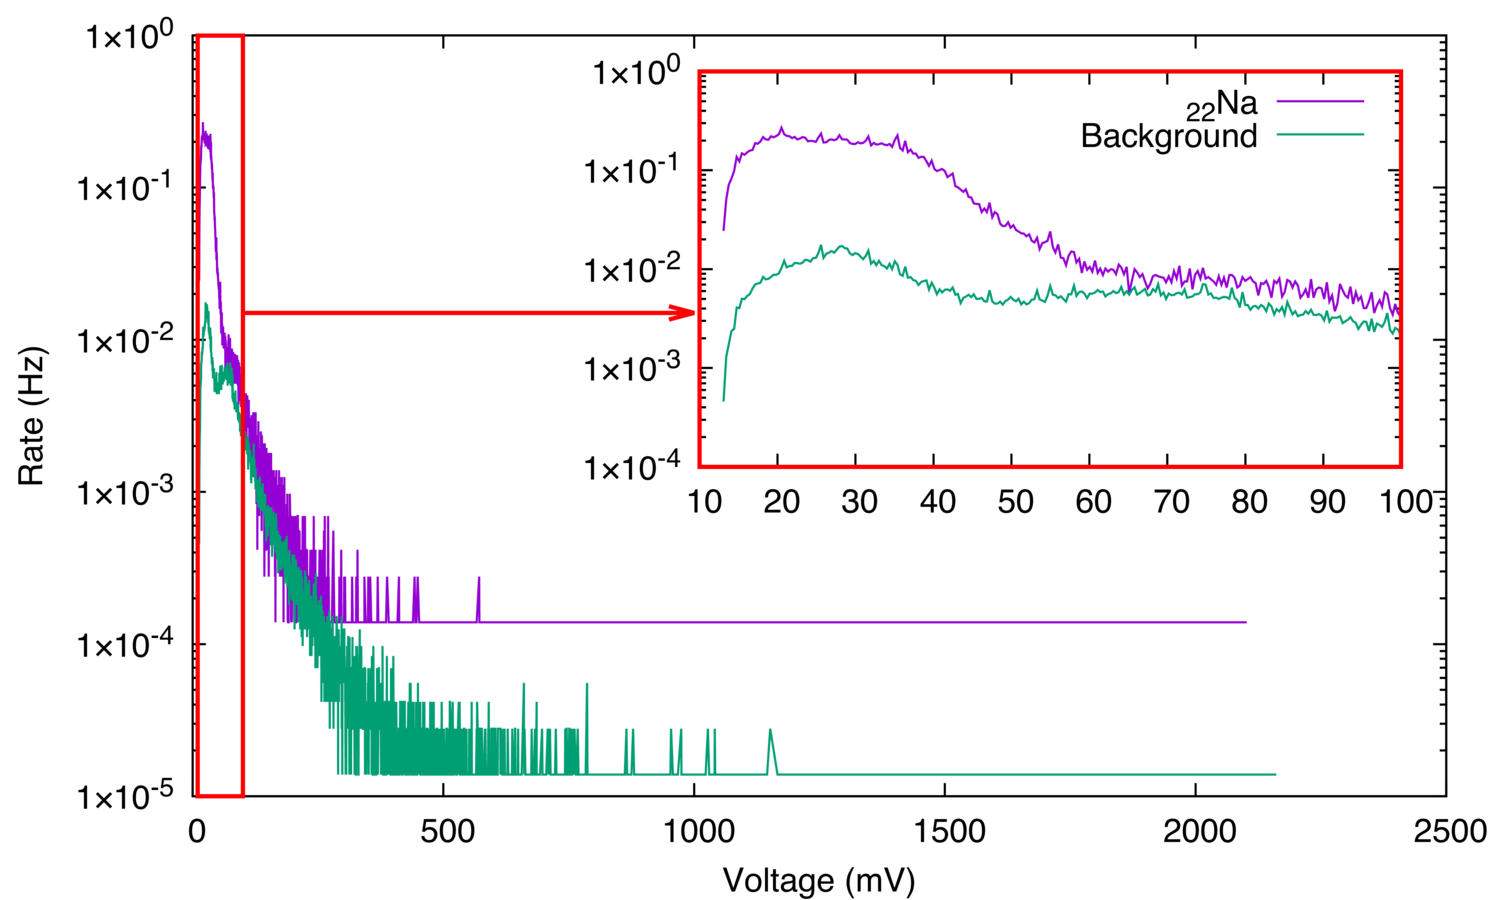 Figure 8: Na gamma ray spectrum from SiPM via coaxial cables.
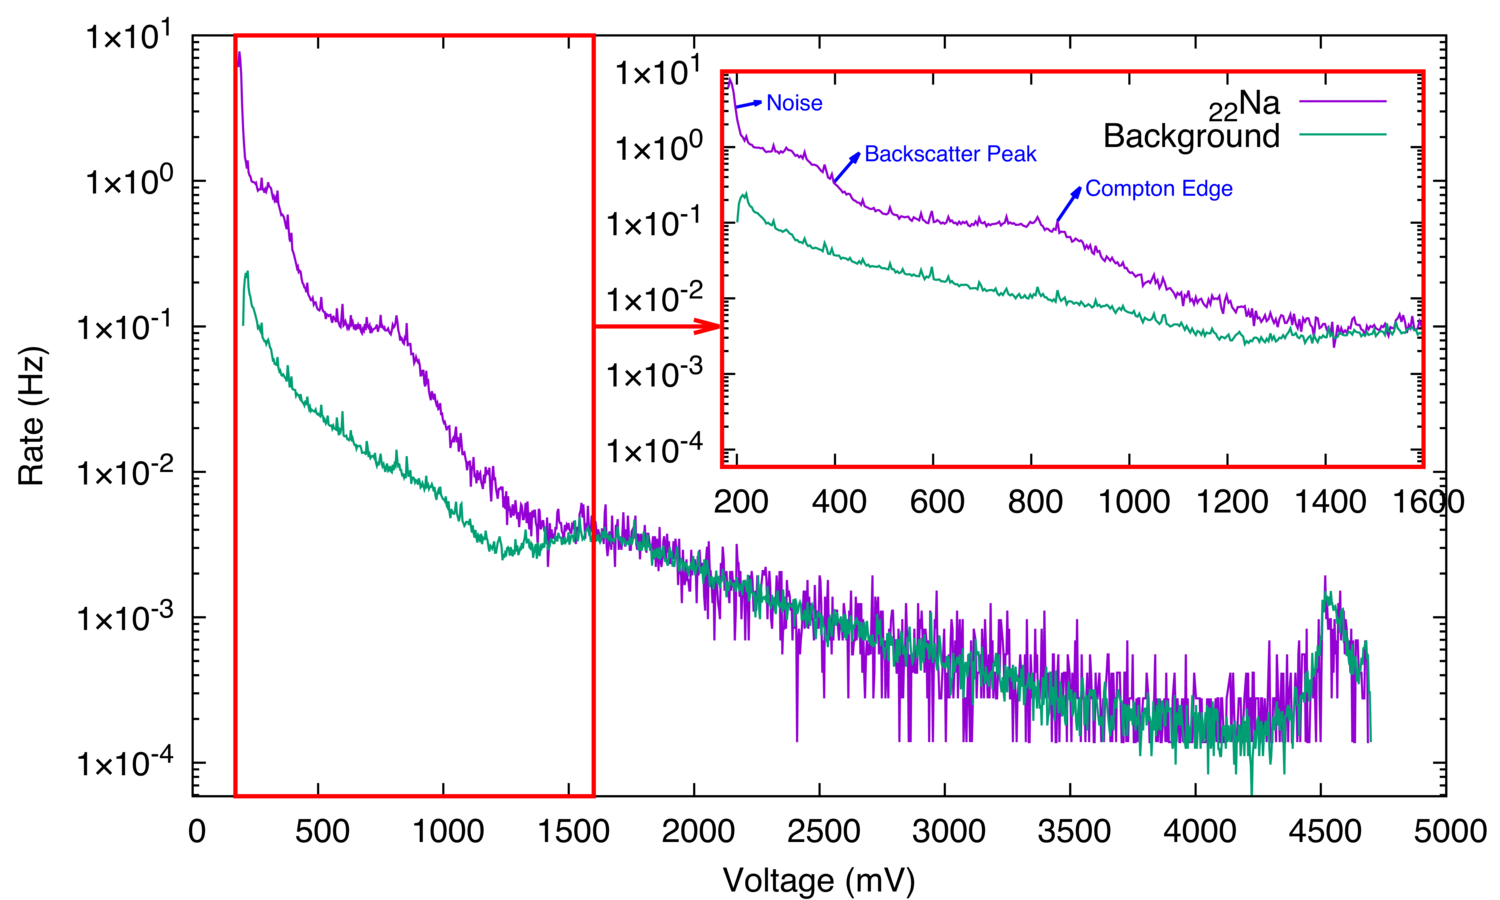 Figure 9: Na gamma ray spectrum from the amplified port.
Data Analysis
The results showed that the readings from the particle detector, when used as a gamma ray spectrometer, are most clearly resembling the expected gamma ray spectrum when the data is read through the amplified port. The backscatter peak and Compton edge are clearly seen. However, the rest of the peaks on the spectrum are not seen because the plastic scintillator has poor gamma resolution. The peak close to 5V is most likely due to the amplification circuit design. The rest of the experiments are going to be performed using the data from the amplified port.
Experiment 2: Antimatter Annihilation
Objective
Observe photon pairs created by positron-electron annihilation.
Materials
- Na radioactive source
- Two particle detectors
- Digilent Analog Discovery 2 oscilloscope
Approach
- Place radioactive source at a constant position.
- Place one detector at a different constant position.
- Rotate the other detector at a 15 degree step from 0 degree to 345 degree keeping the distance to the source the same.
- Measure the total rate from the first detector as well as the coincidence rate for each step.
- Observe the difference in rate for each step.
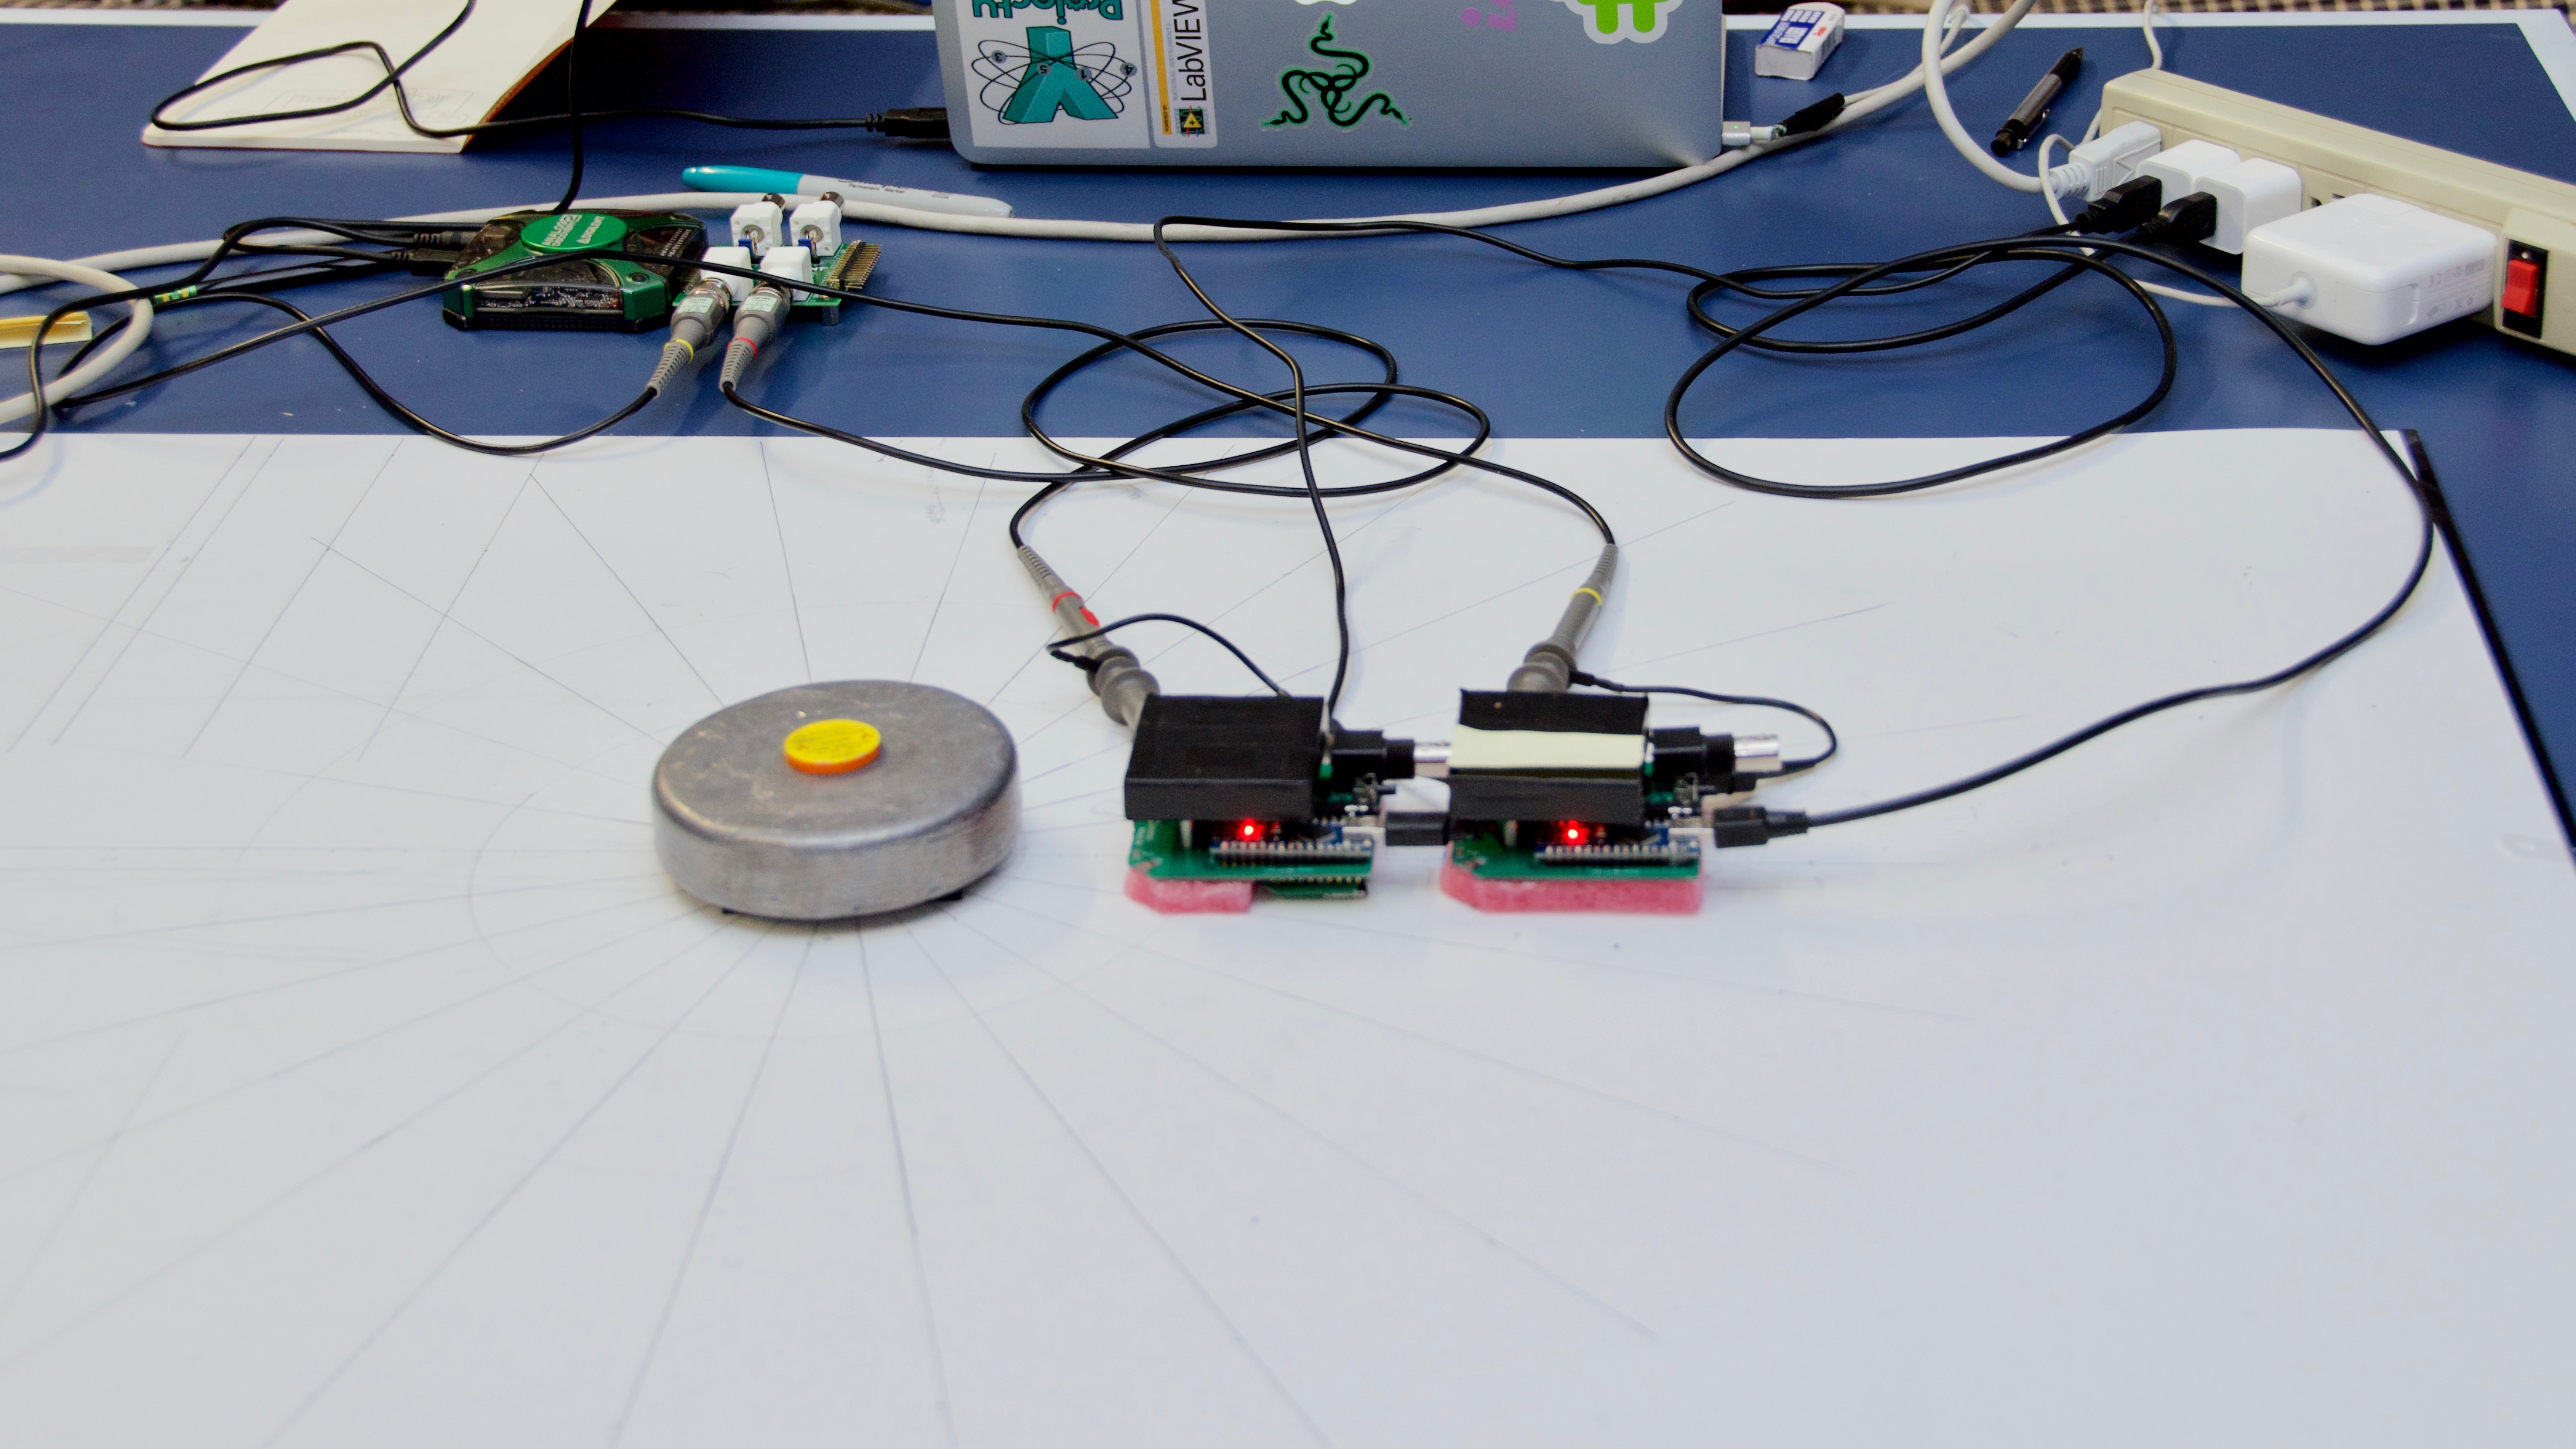
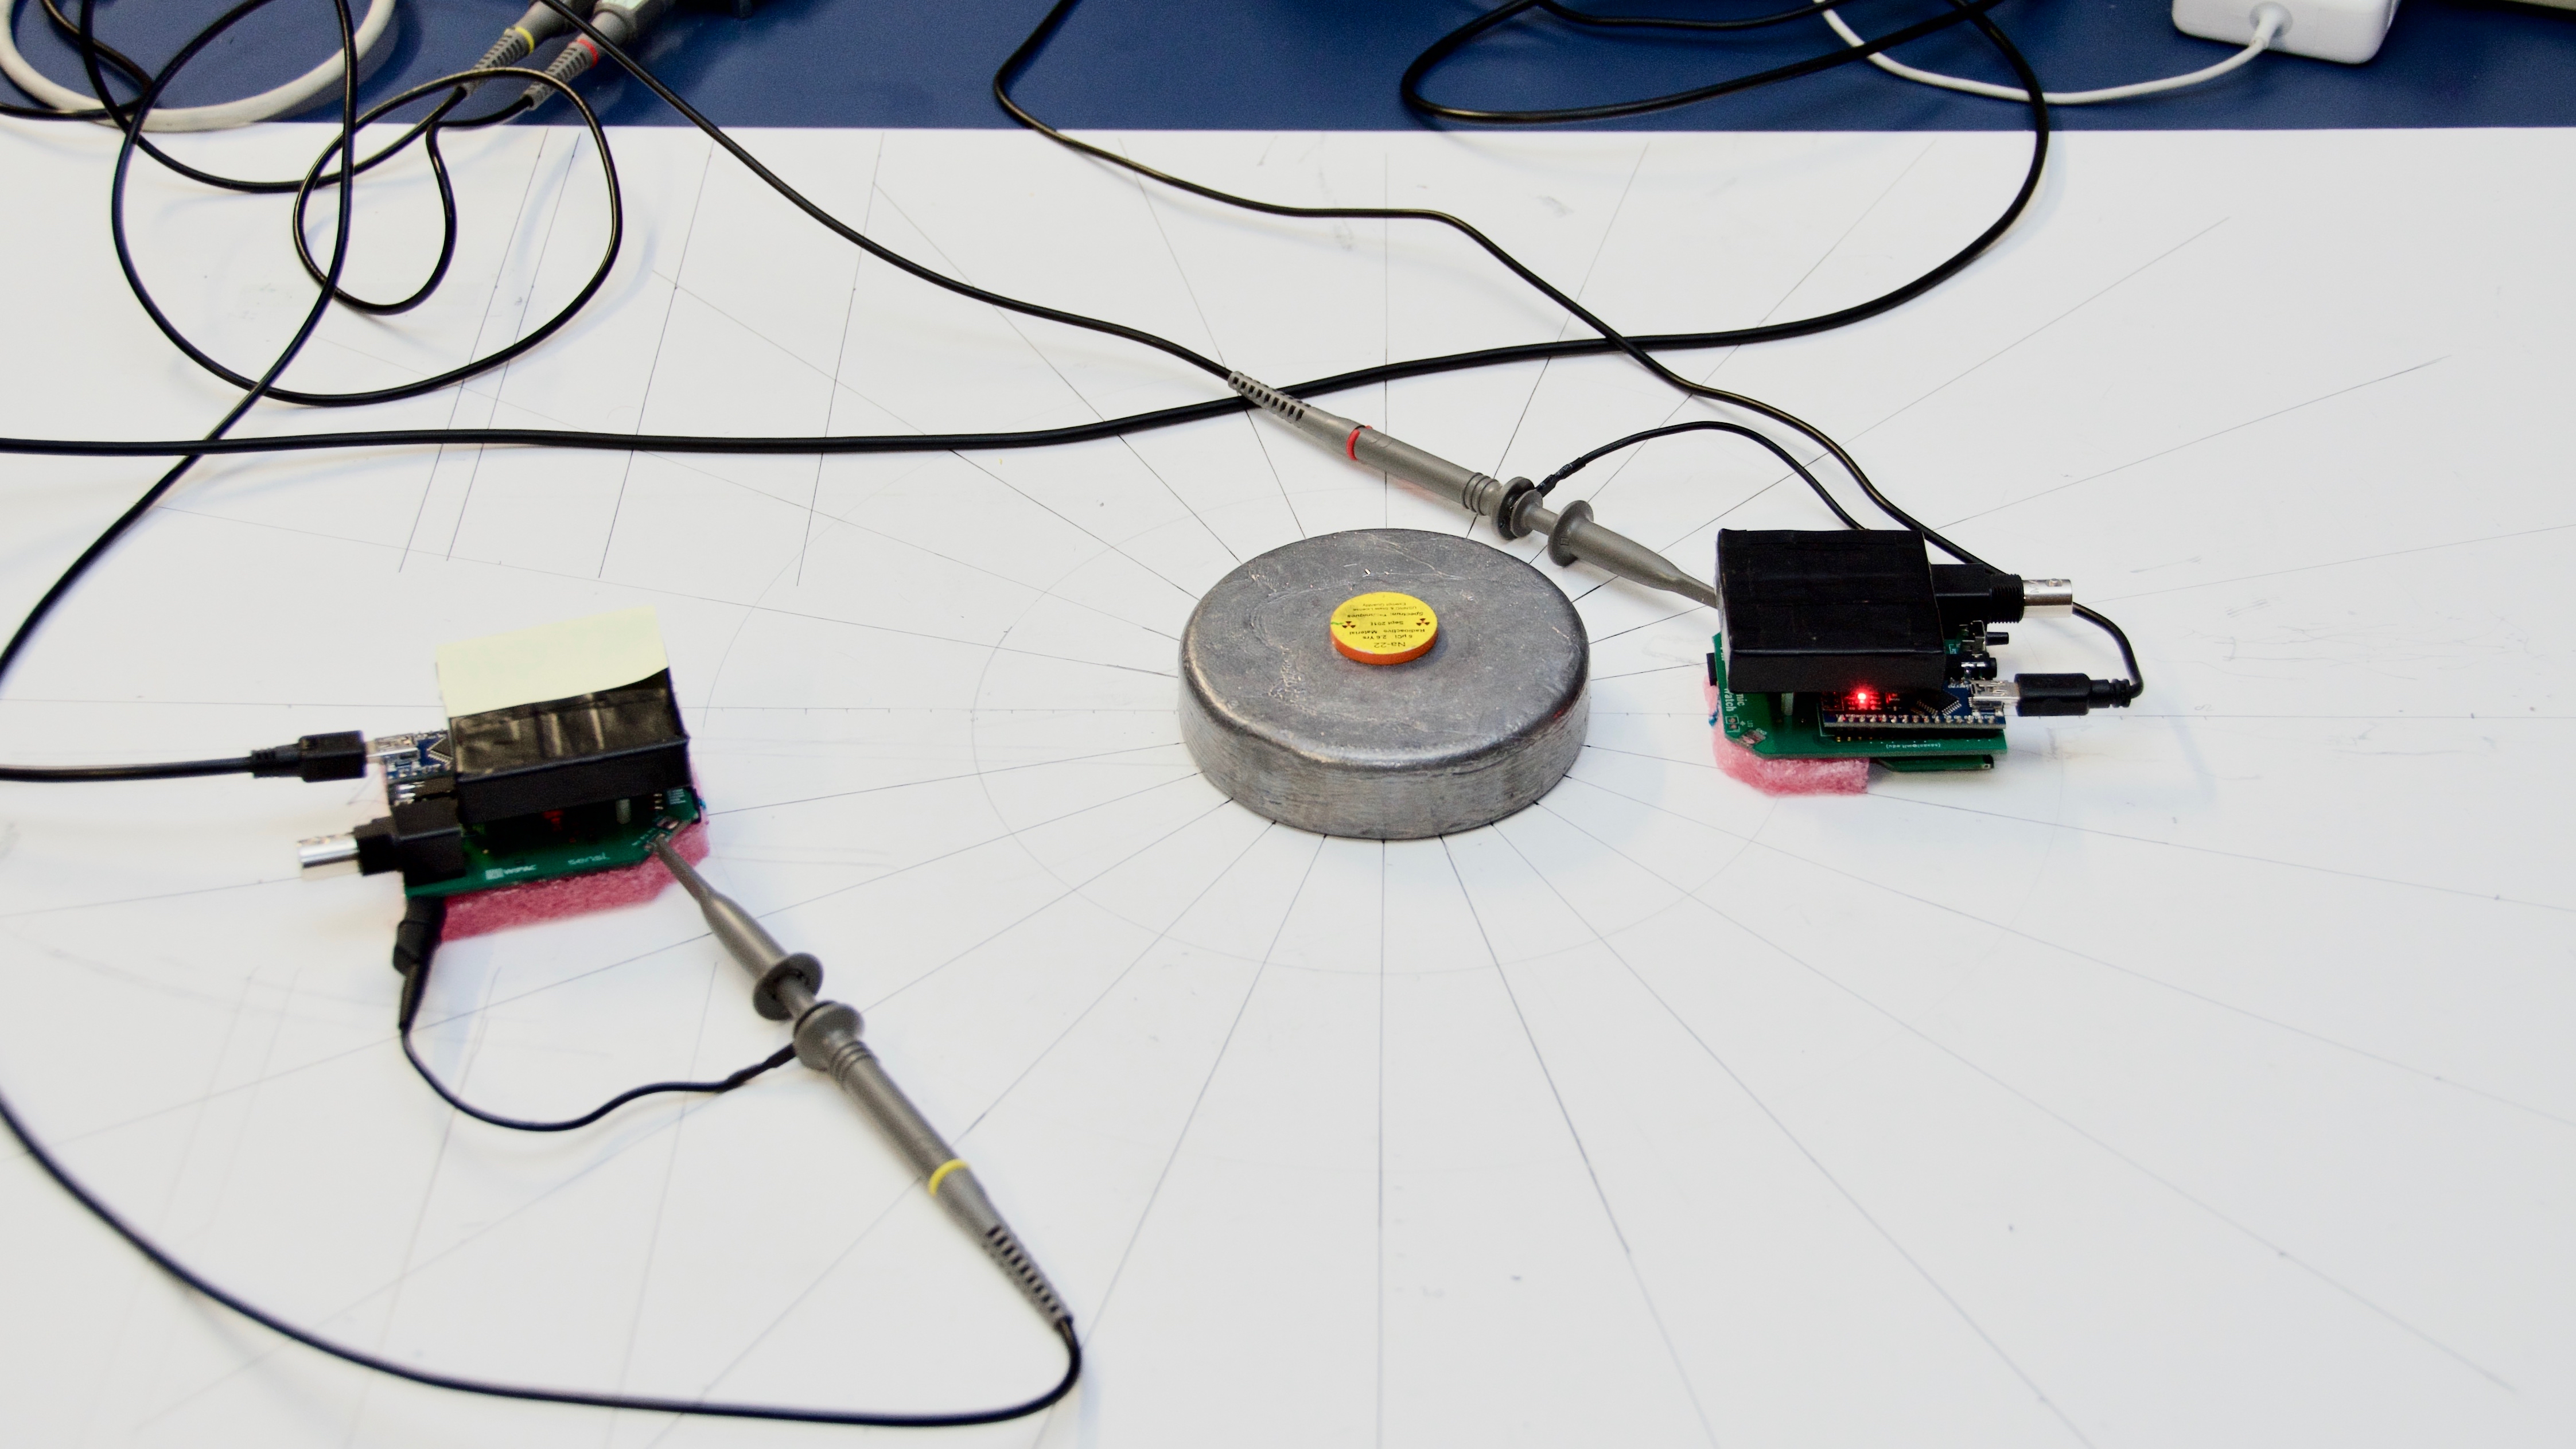
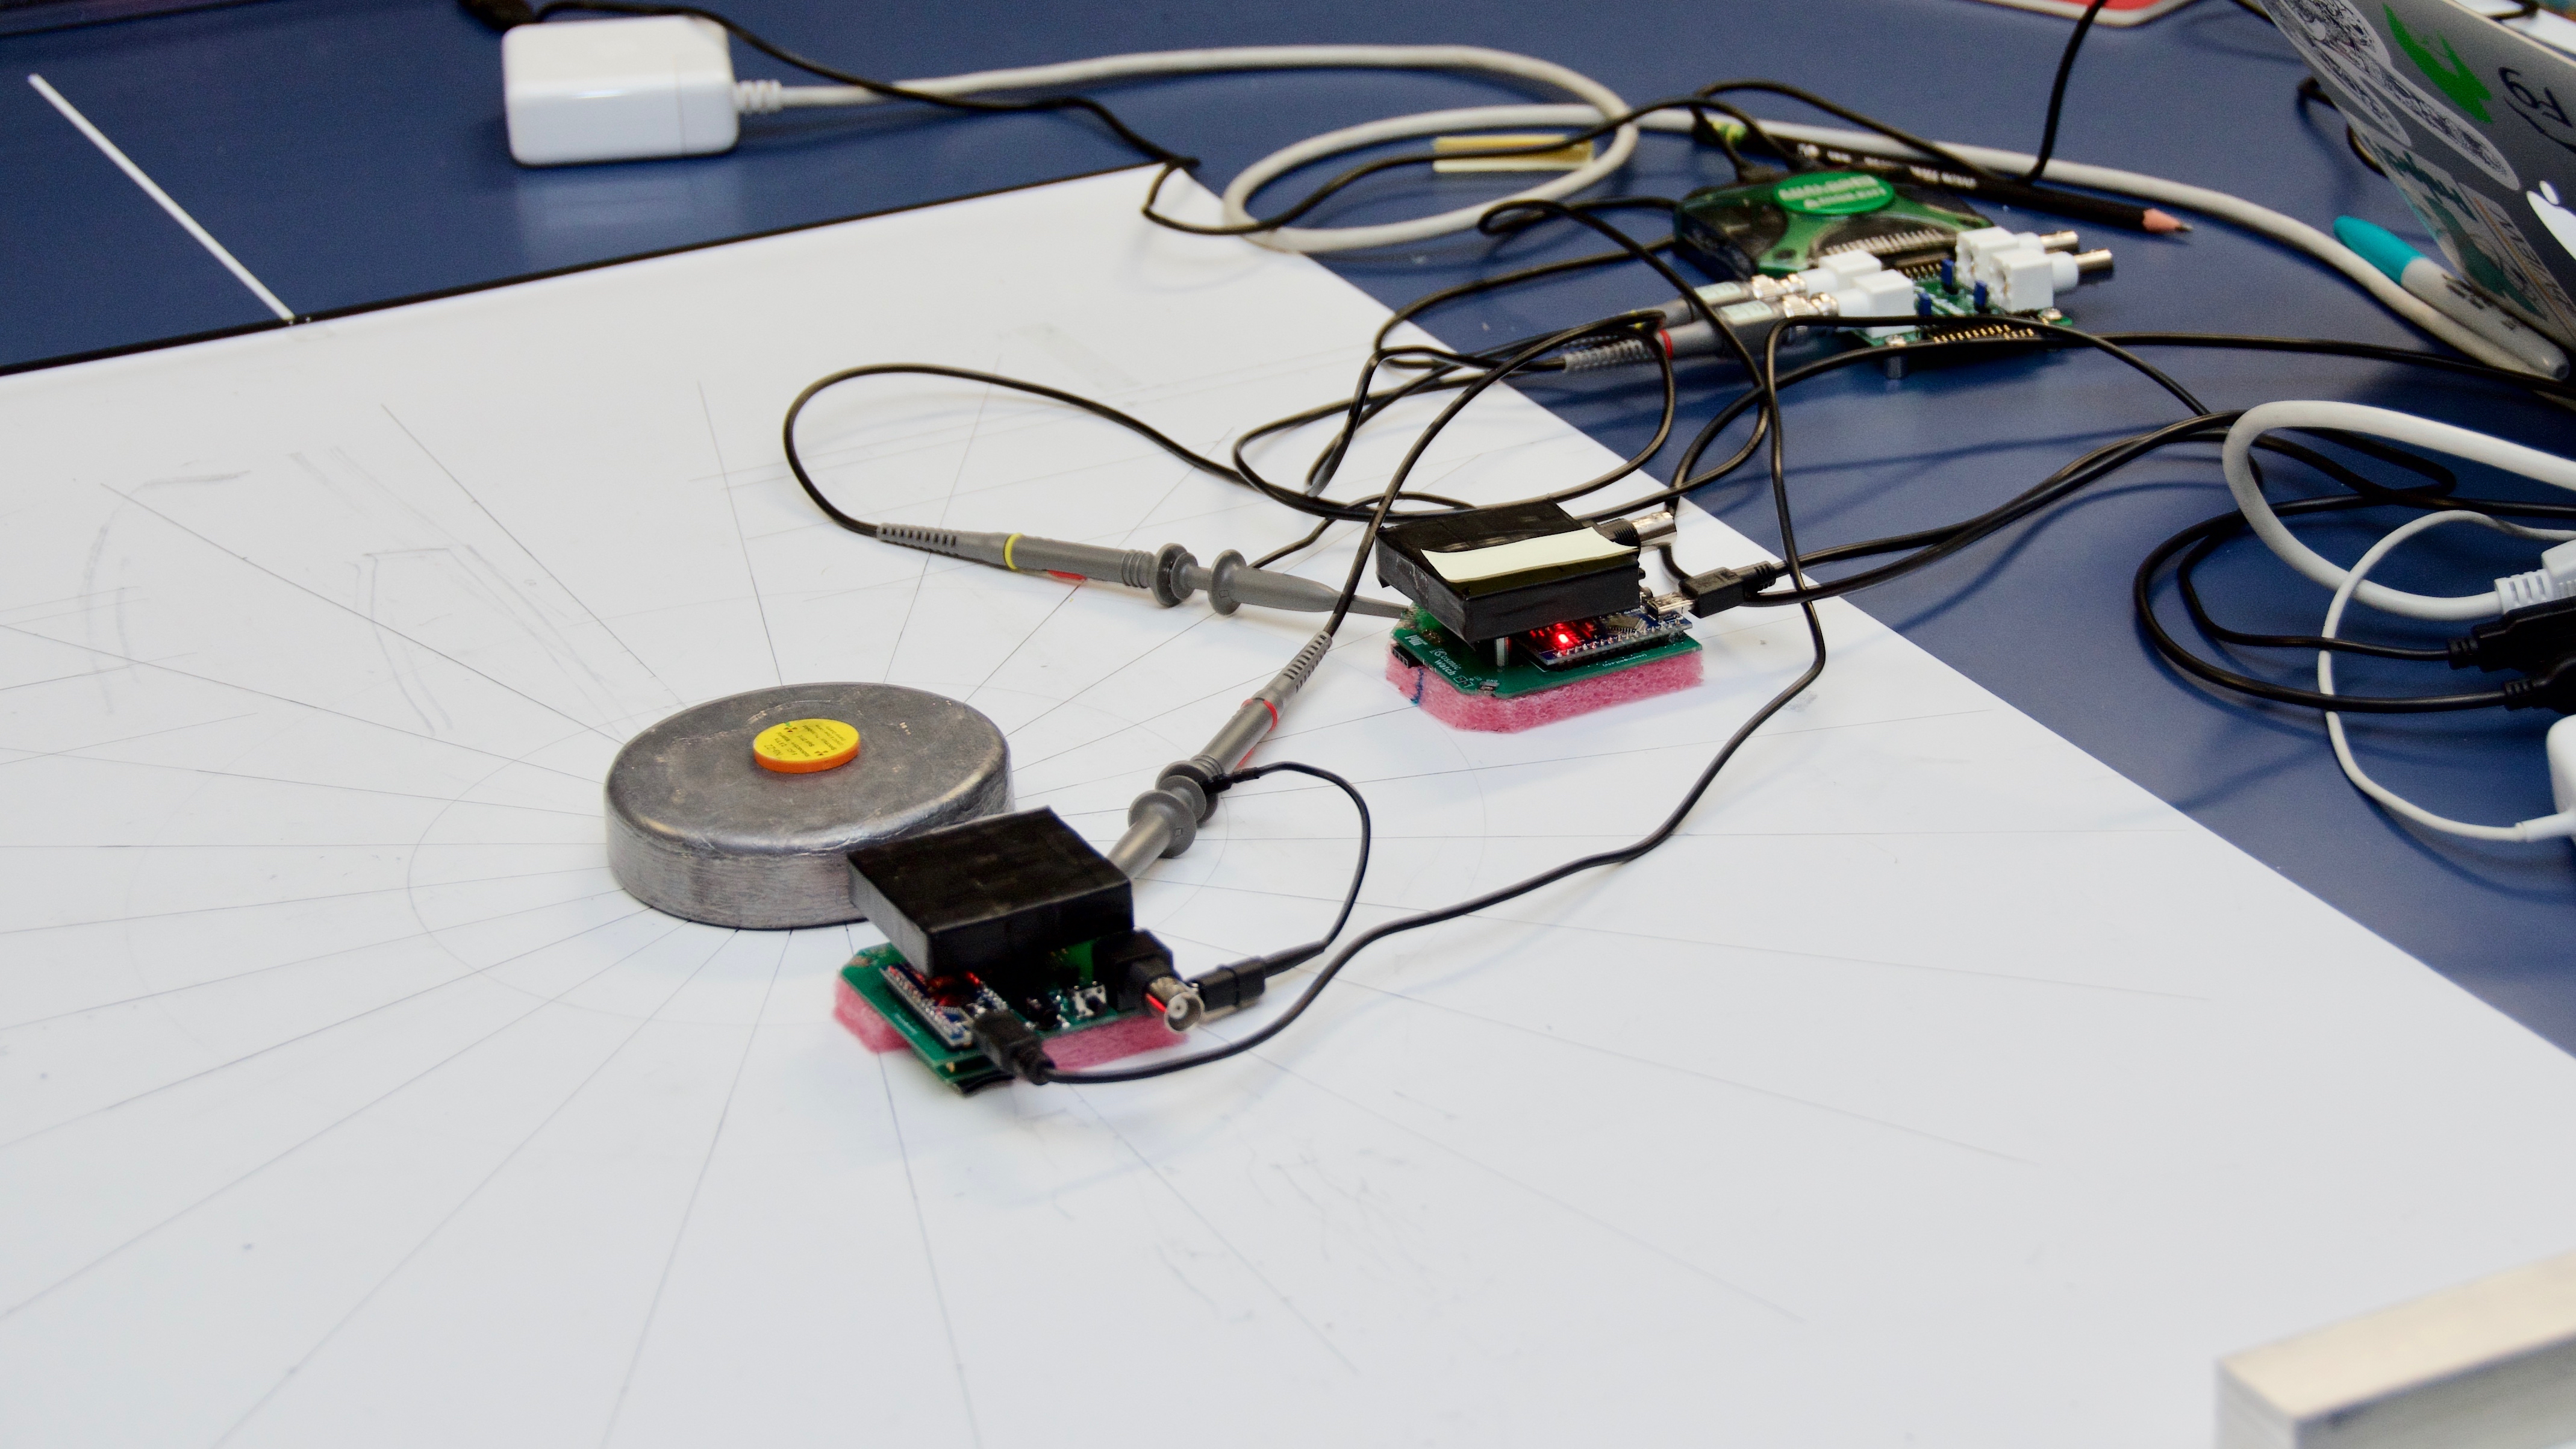 Figure 10: Experimental Setup
Description
Na atoms decay into Ne, producing positrons. The positrons annihilate with some electrons, resulting in a pair of gamma ray photons. Theoretically, these particles will travel in the exact opposite direction. We can detect these pairs if two particle detectors are placed straight across from each other with the source in the middle. The rate of coincidental particle detection will be lower if the two particle detectors are not at a 180 degree angle.
Results
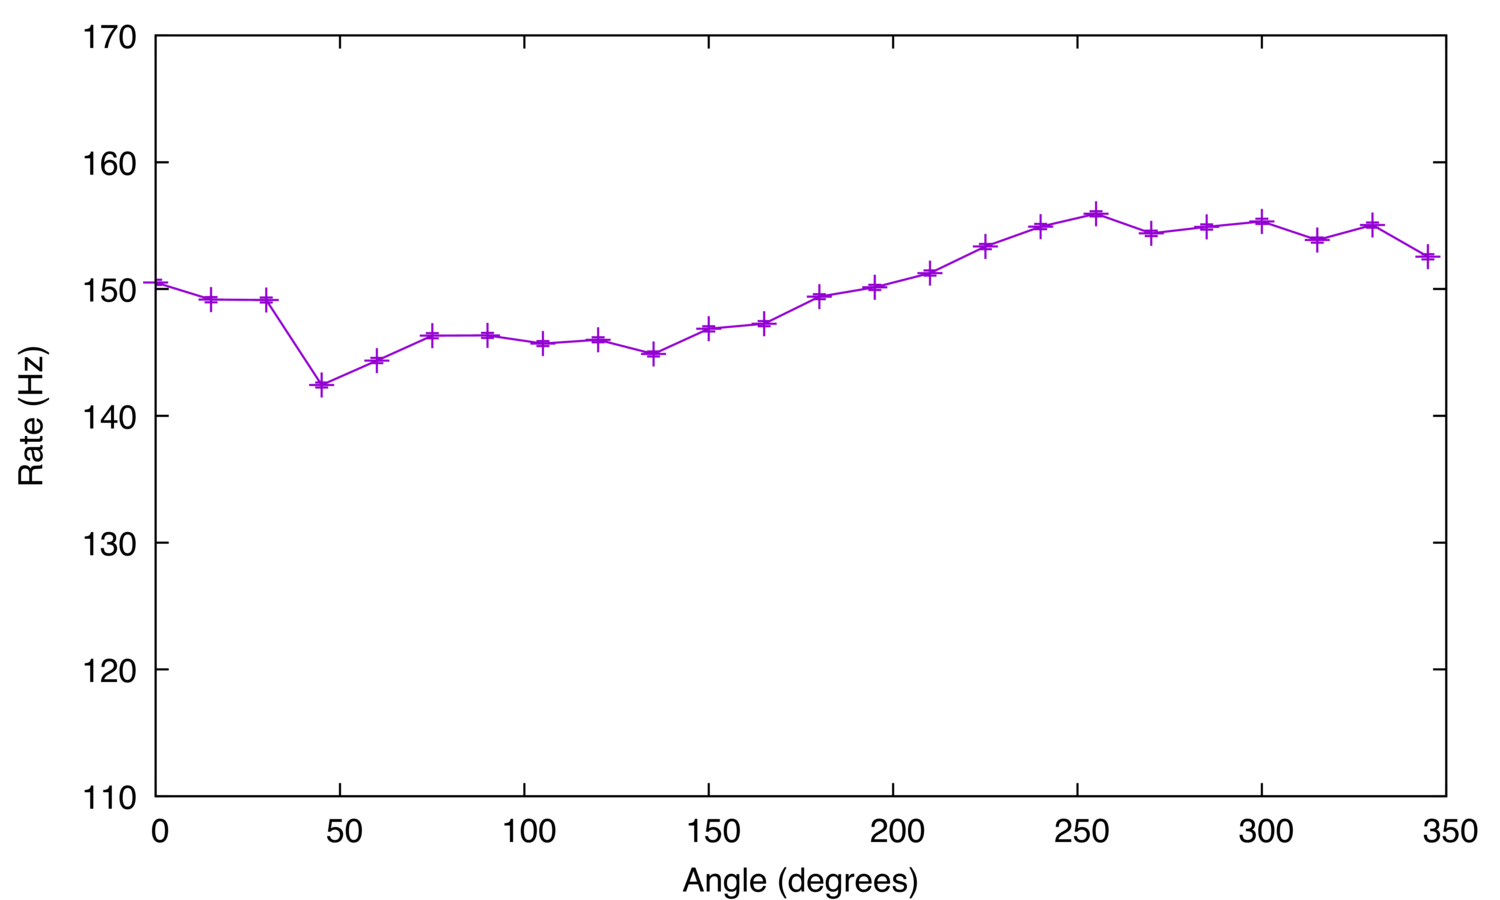 Figure 11: Effect of Angle on Total Rate.
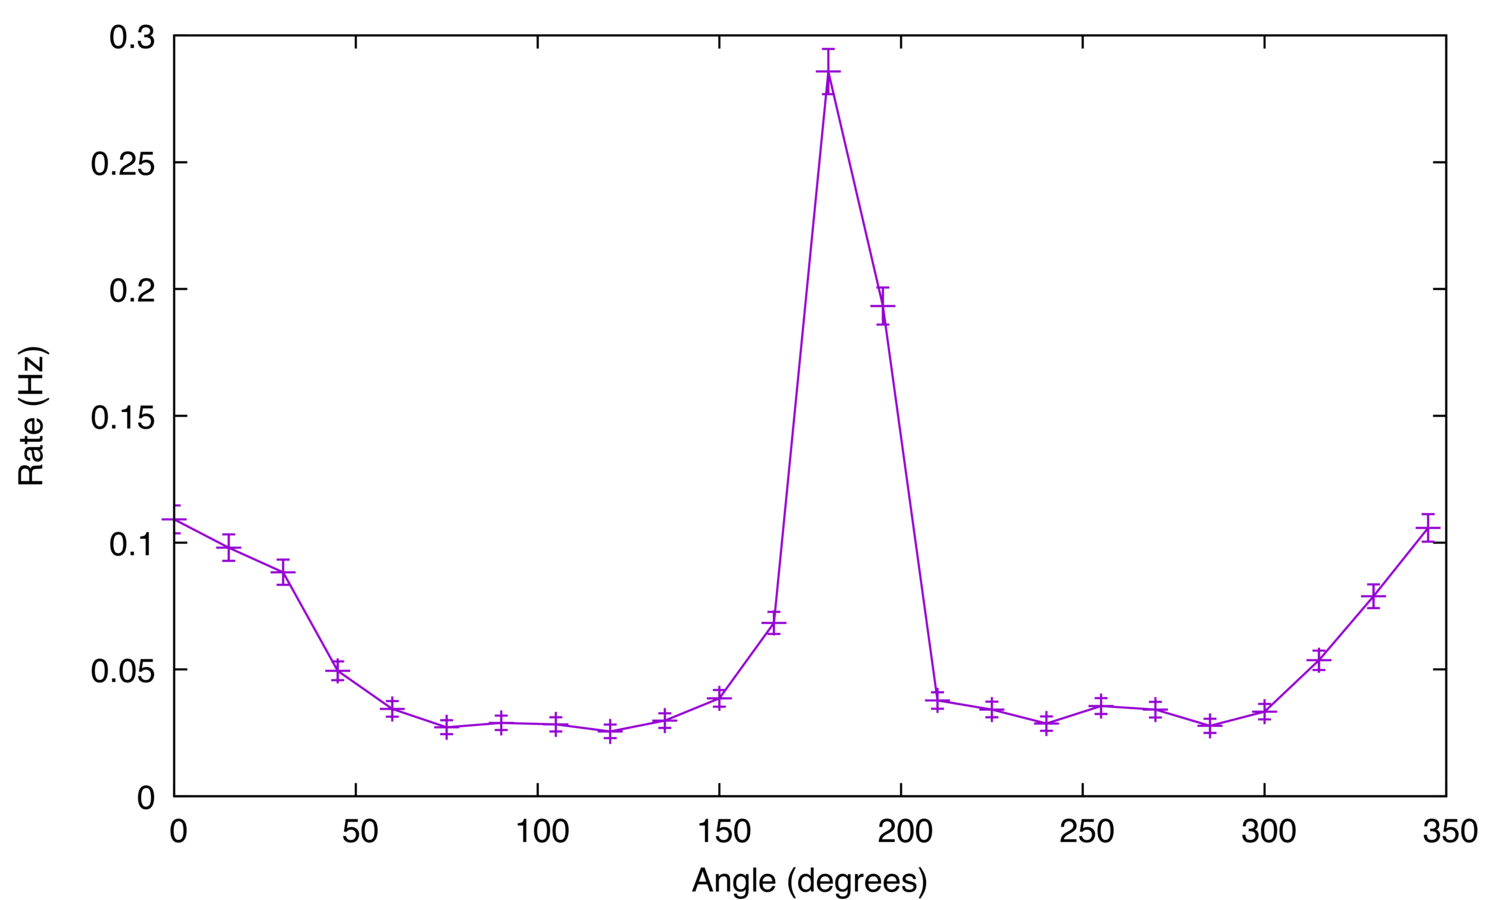 Figure 12: The Effect of Angle on Coincidence Rate.
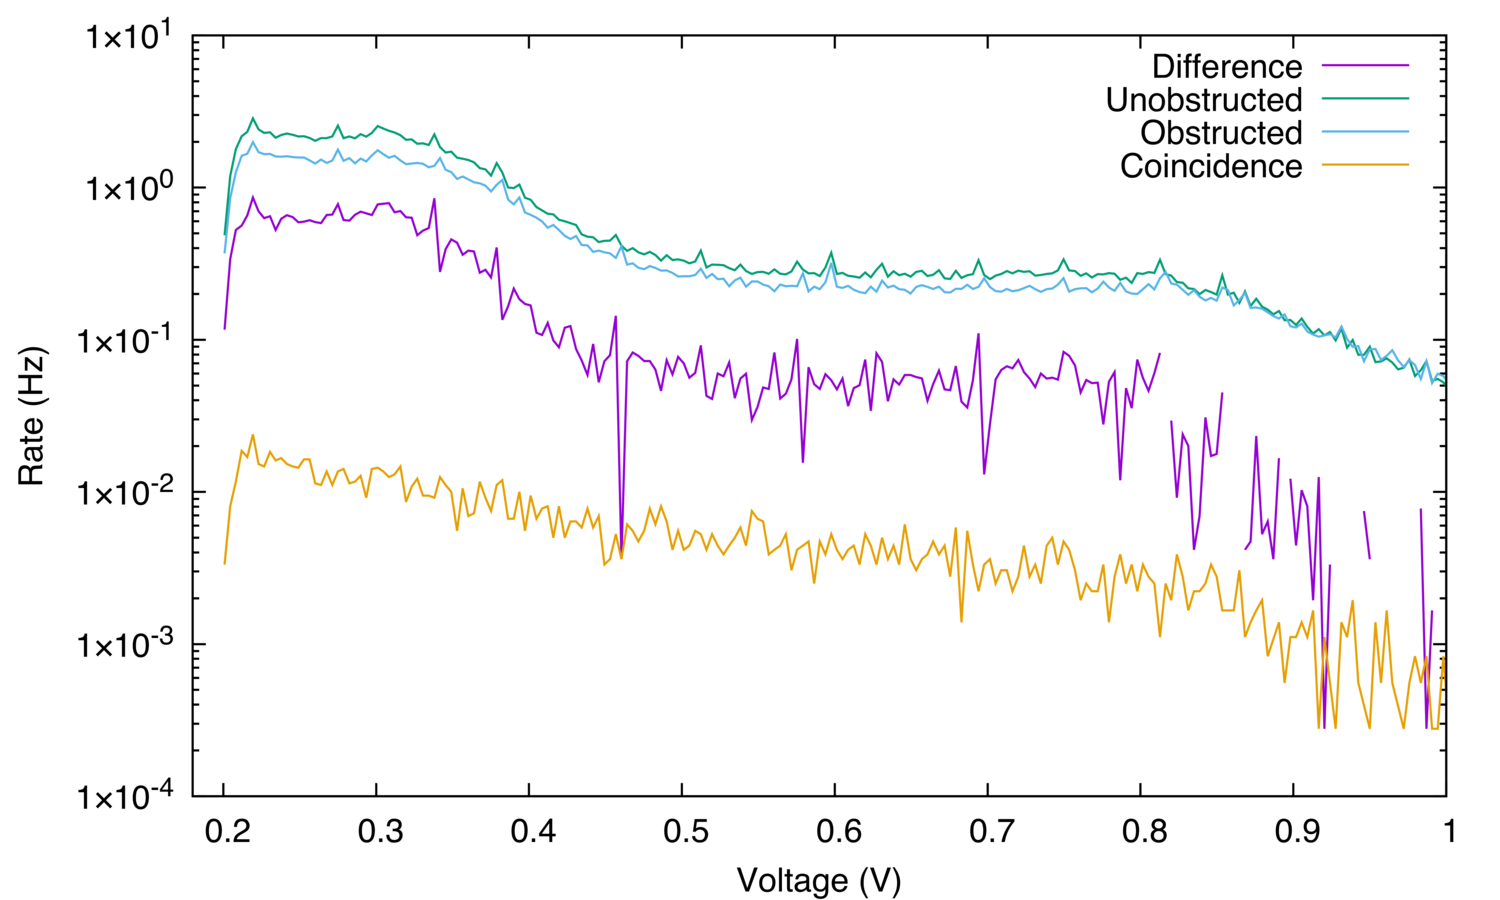 Figure 13: Effect of Particle Energy on Interference at 0 degree.
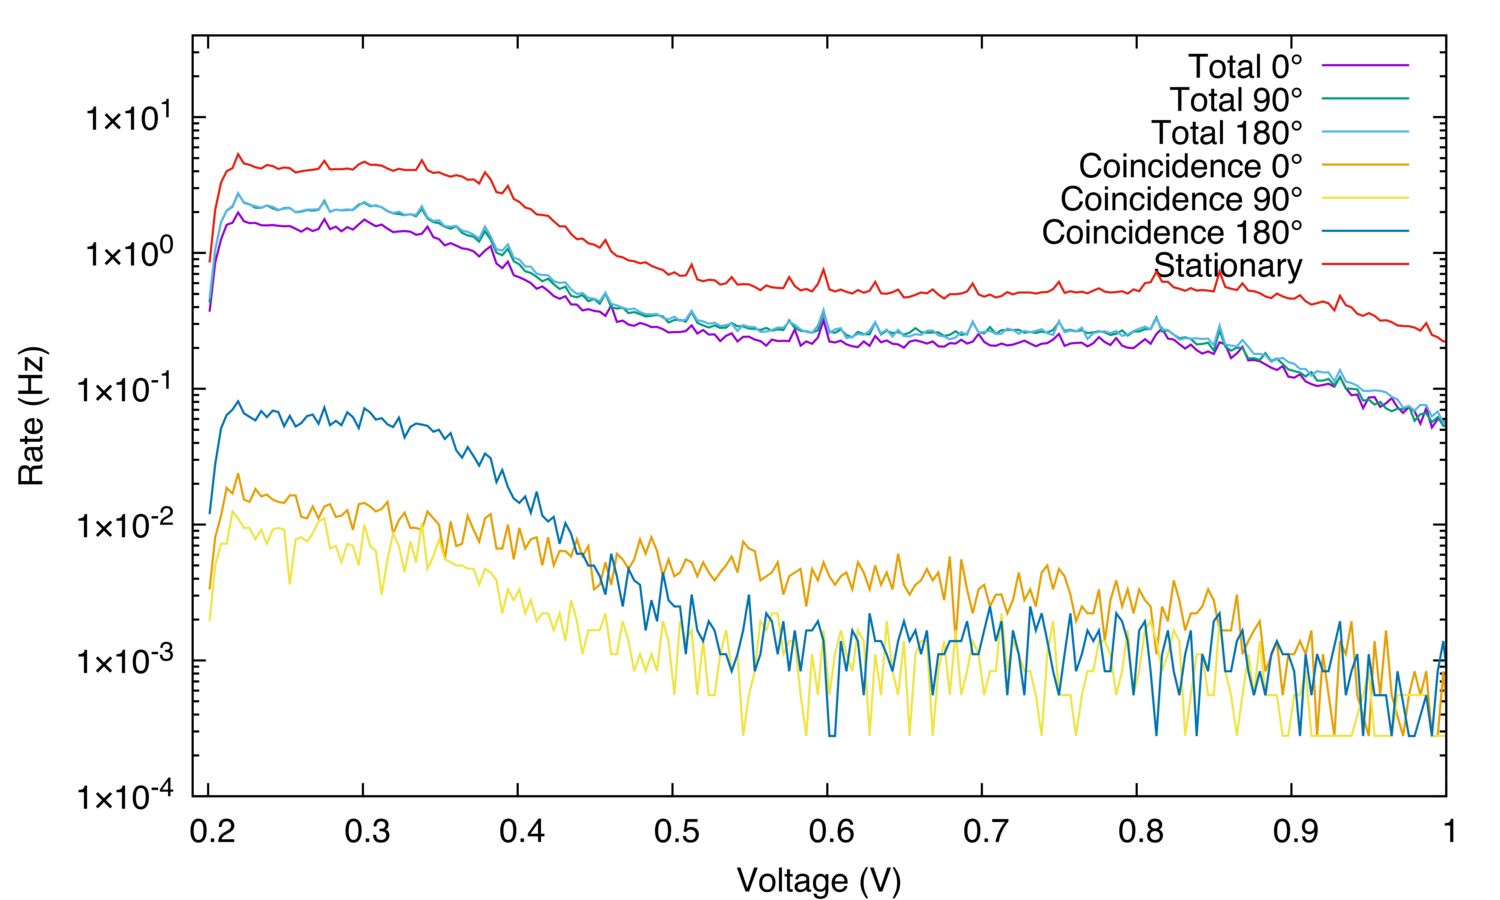 Figure 14: Effect of particle energy on interference at 0, 90, and 180
degrees.
Figure 14: Effect of particle energy on interference at 0, 90, and 180
degrees.
Data Analysis
The results demonstrate that the radioactive source produces positrons. As predicted by theory, photon pairs created by positron-electron annihilation are more often seen at 180 degree, and the results from the effect of particle energy on interference show that most of these pairs are in the range 0 - 0.4 V. Figure 11 shows that the radioactive source is not homogeneous and the radiation it produces is not isotropic. Following experiments need to consider this fact.
Experiment 3: Observe Quantum Entanglement
Objective
Observe entangled particles from a Na source.
Materials
- Na radioactive source
- Two particle detectors
- Digilent Analog Discovery 2 oscilloscope
- Two lead collimators
- Two aluminum cubes
Approach
- Place radioactive source in between two aluminum cubes, and then place the detectors on the aluminum cubes.
- Place each of the detectors on the top, left, and right side of the cube.
- Measure the coincidence rates for one hour.
- Repeat for all nine orientations.
- Rotate the radioactive source to 180 degree to compensate for the non-uniformity of the source.
- Repeat the measurements.
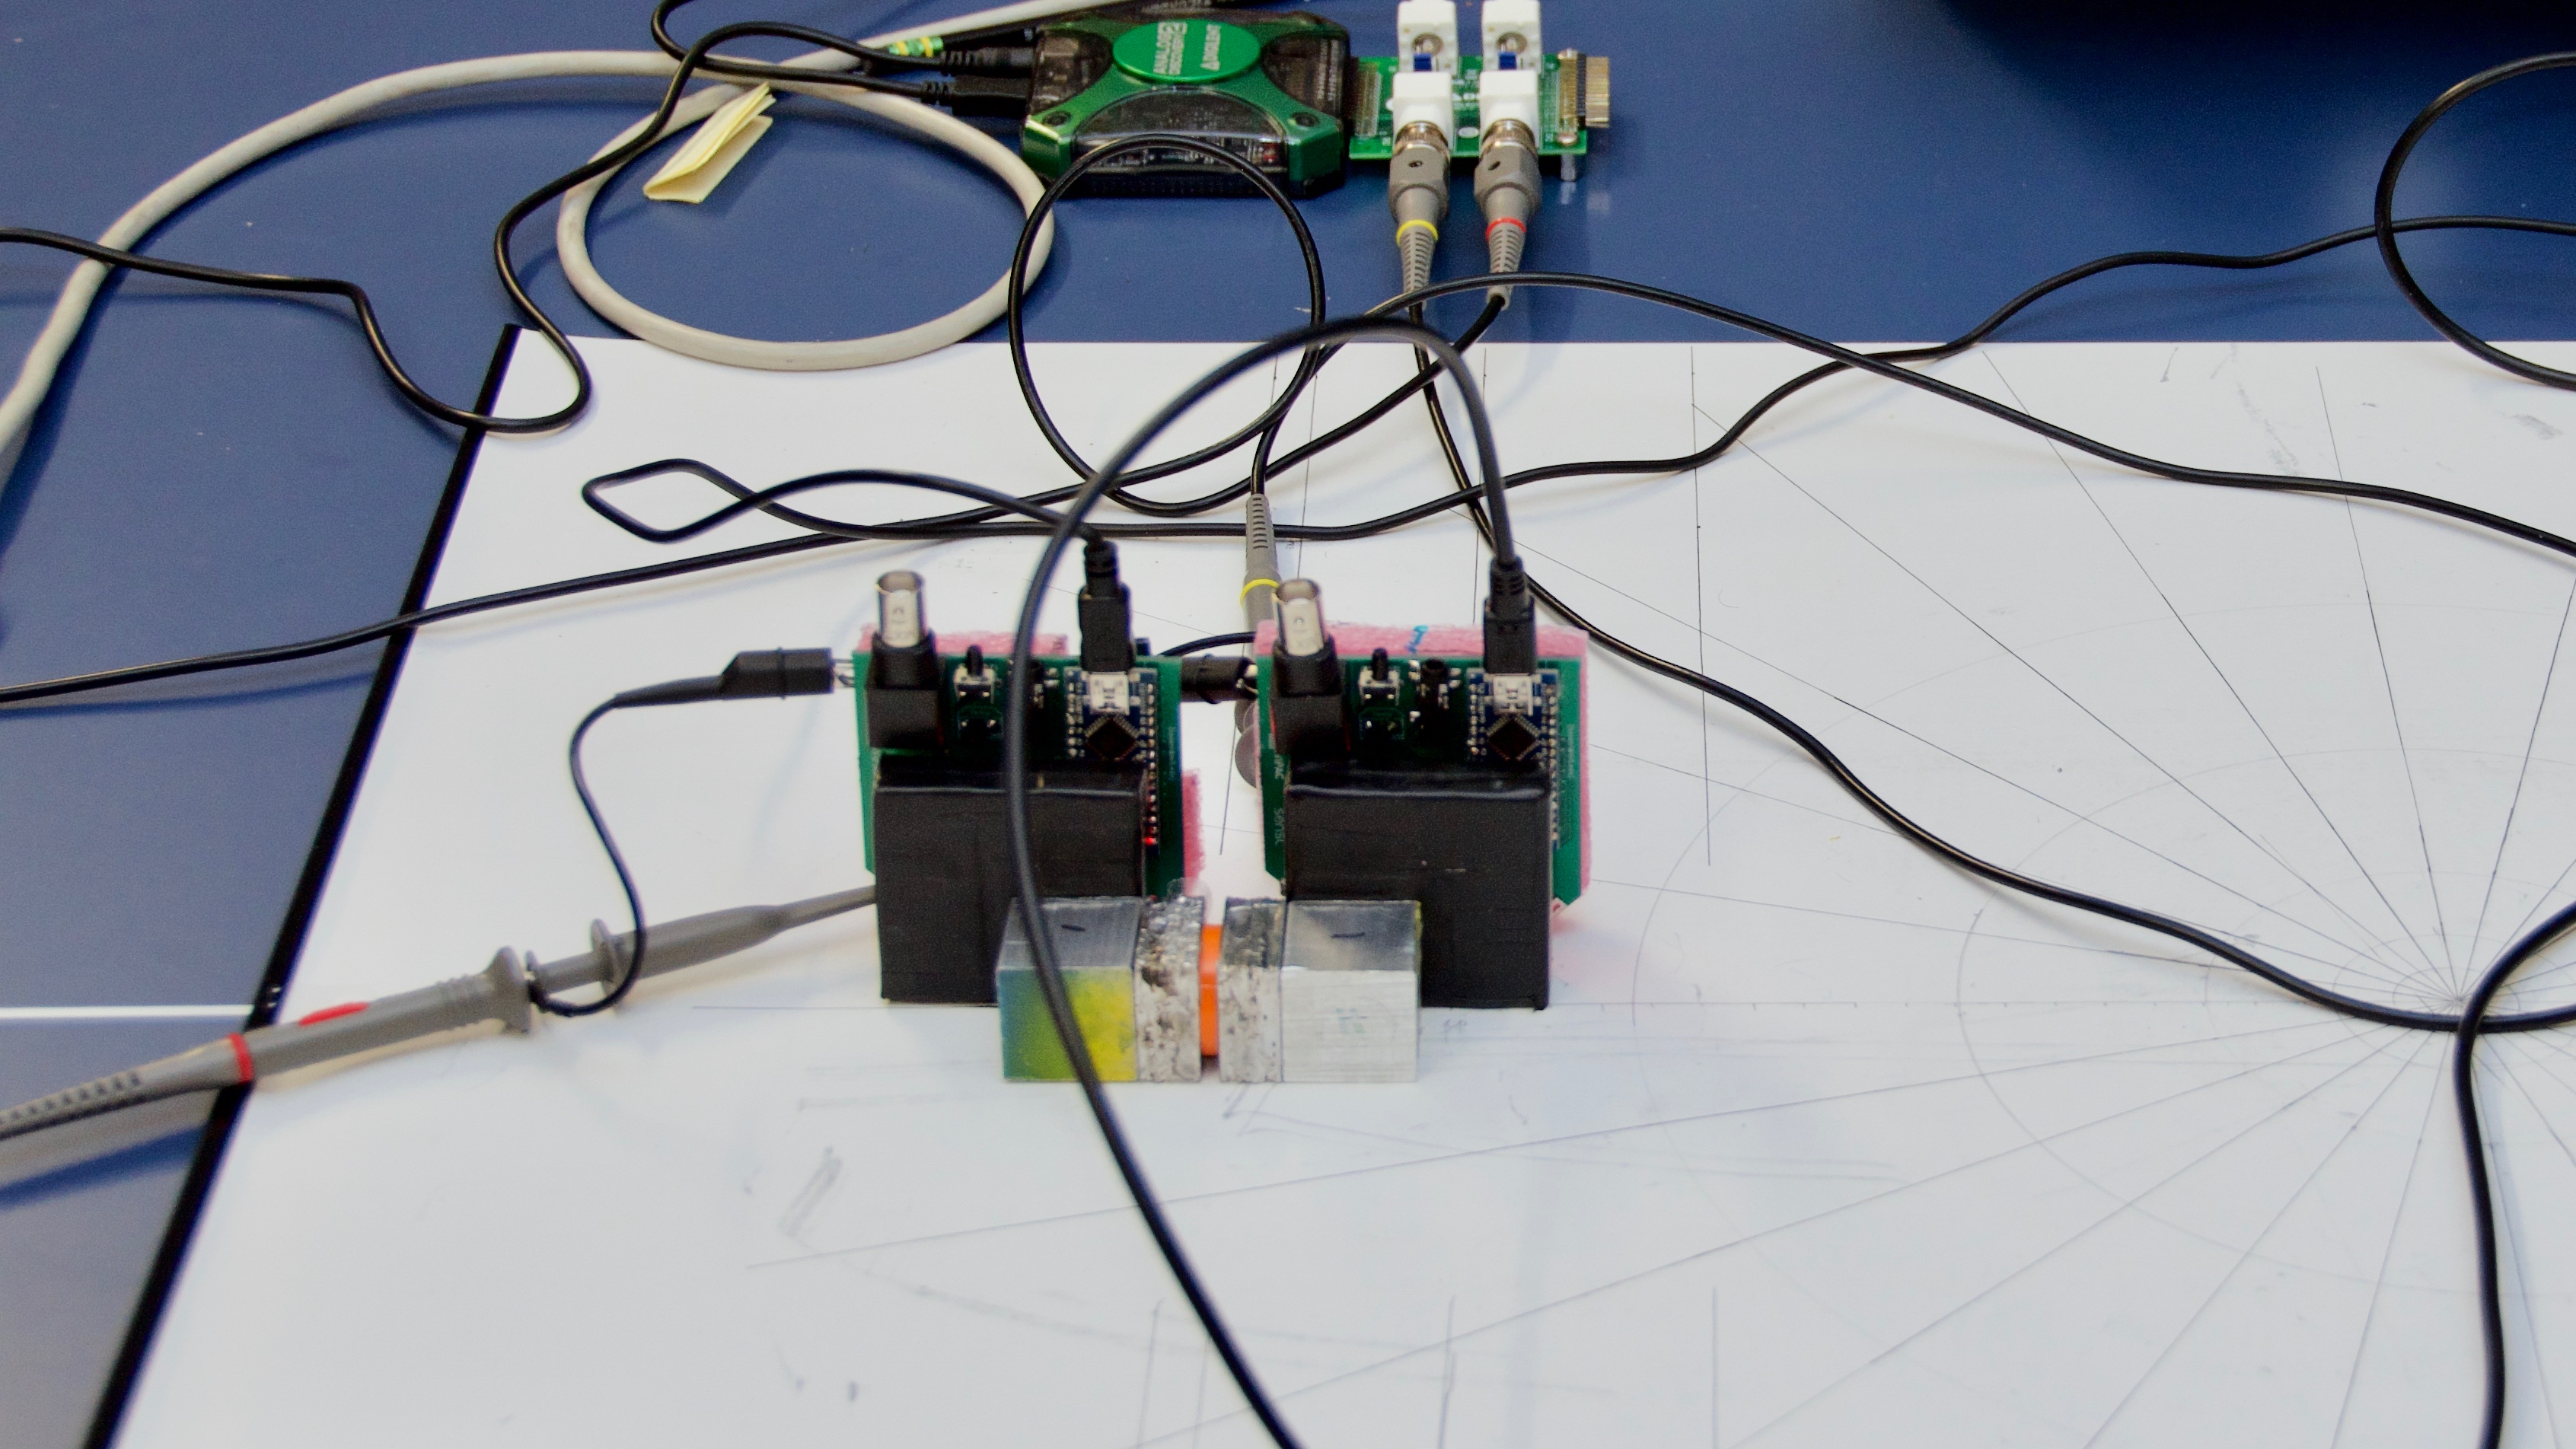
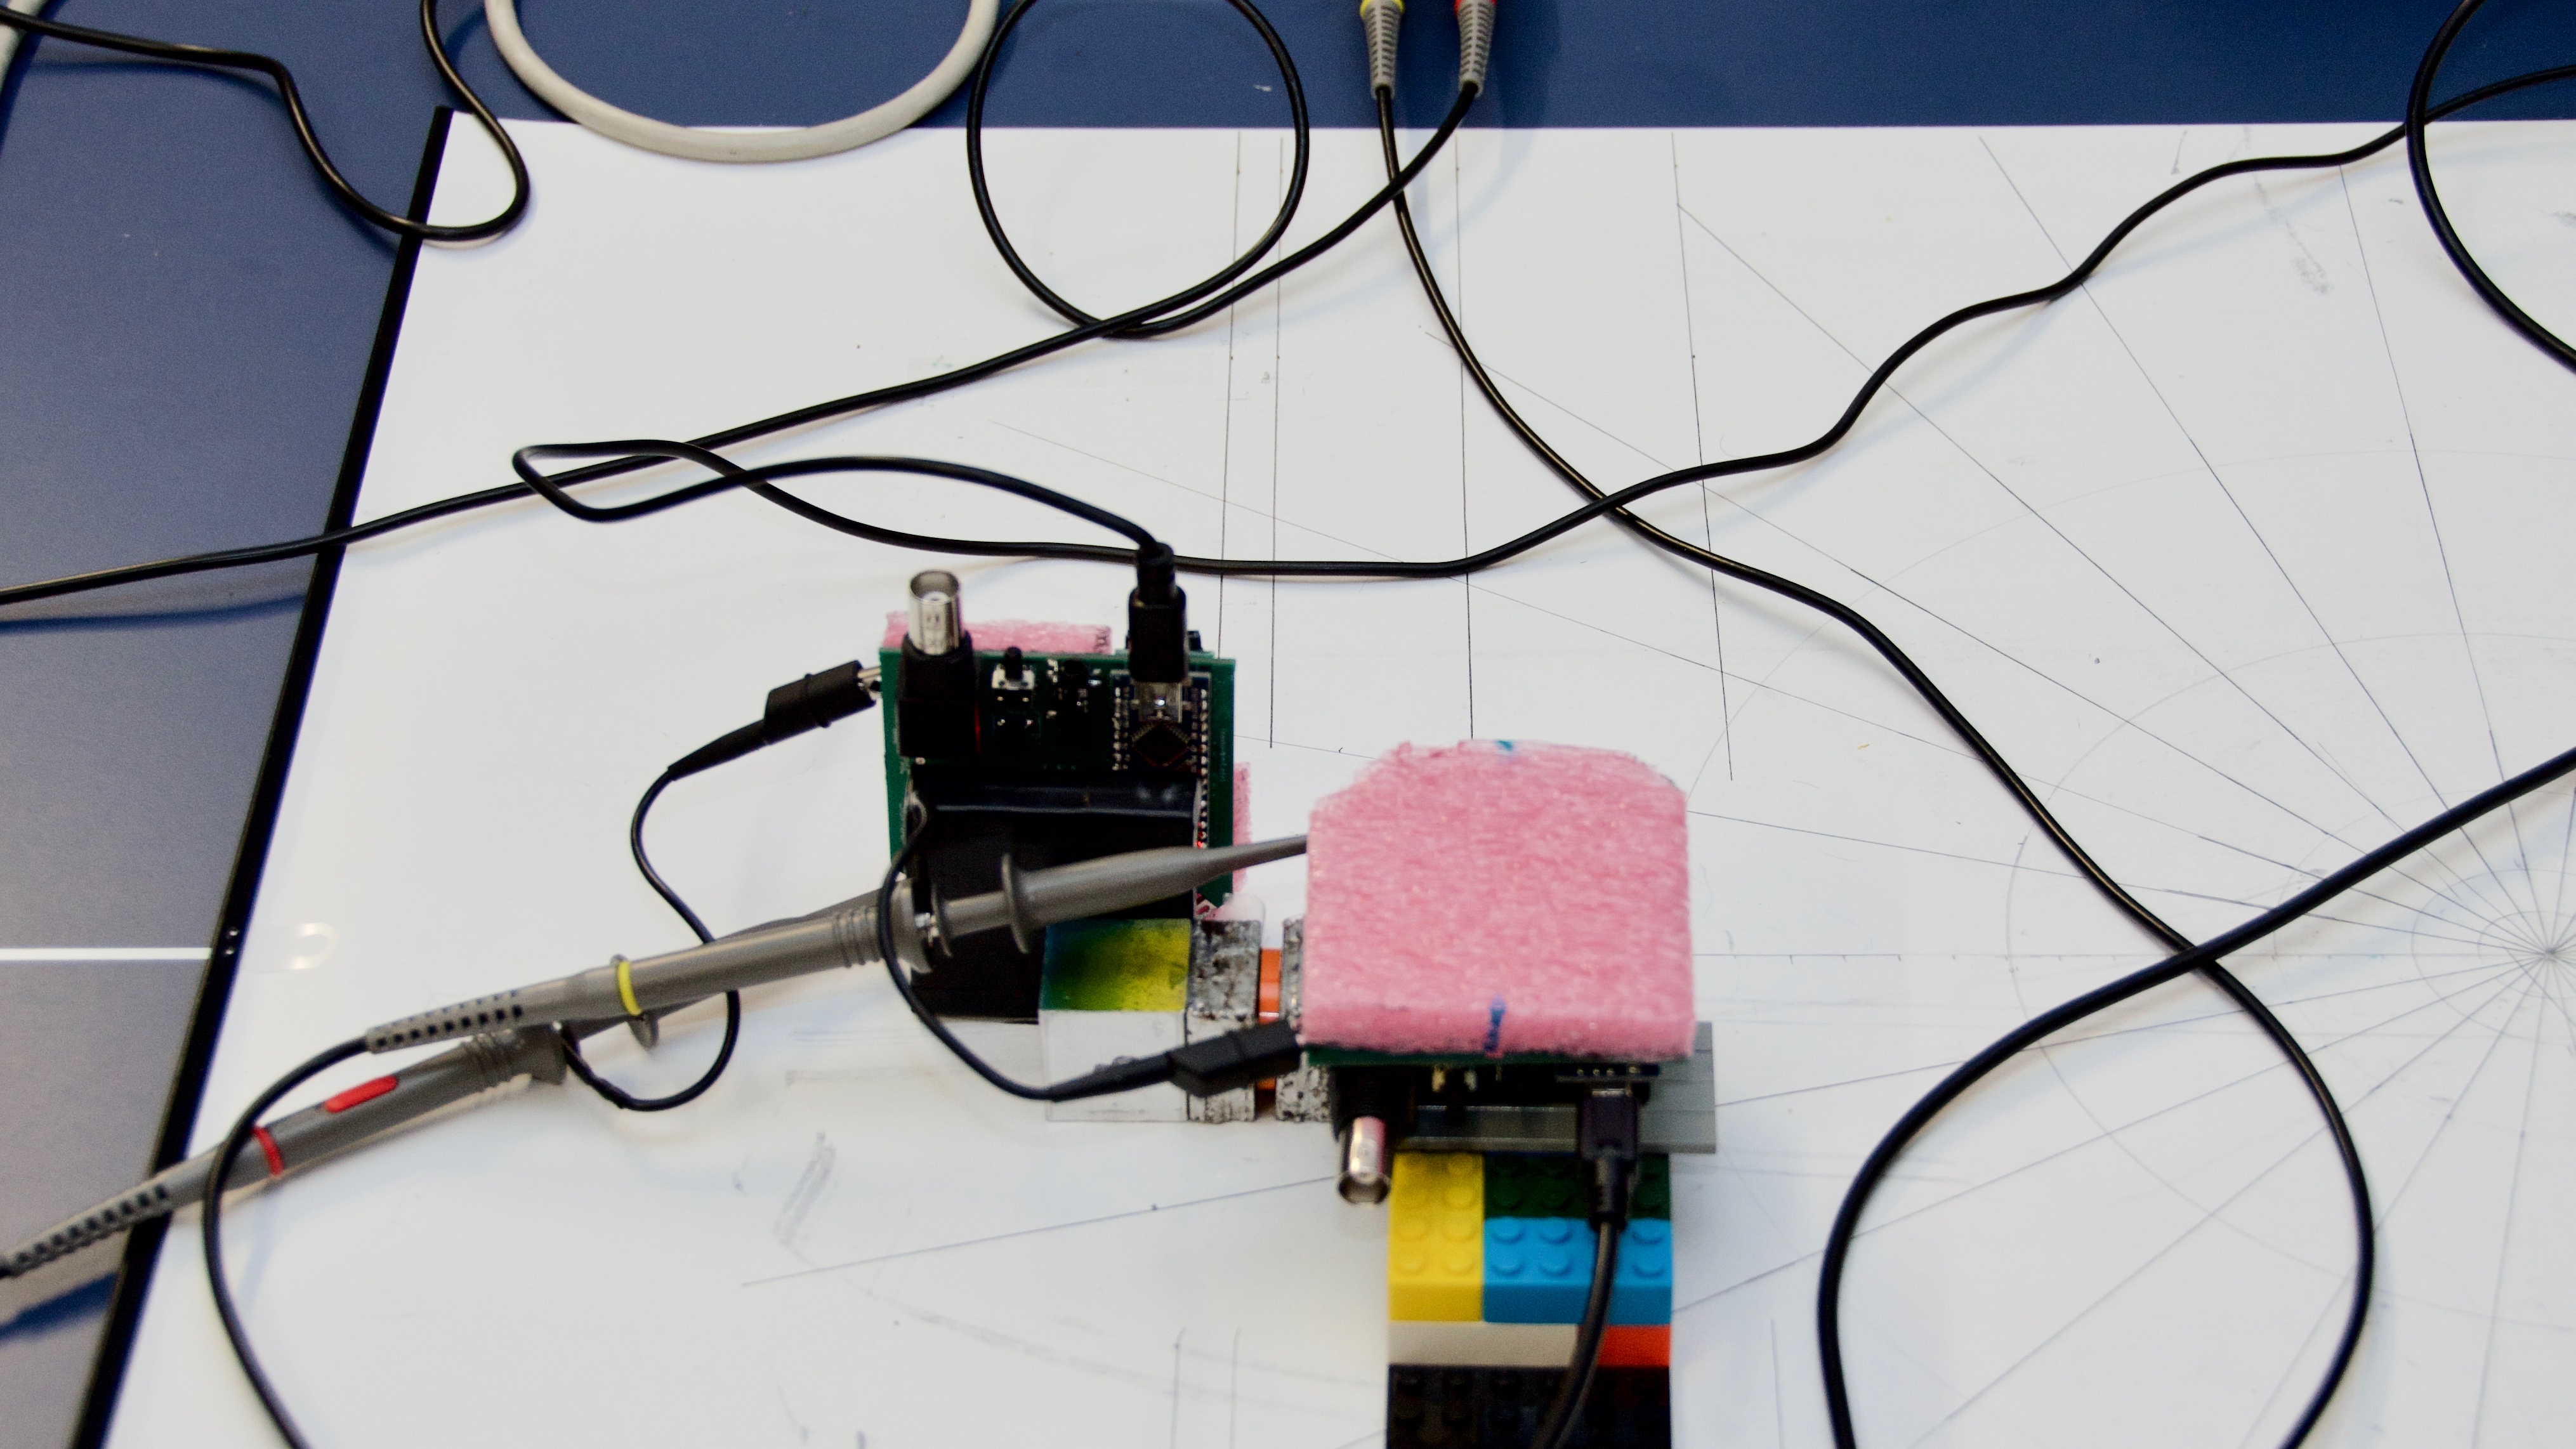
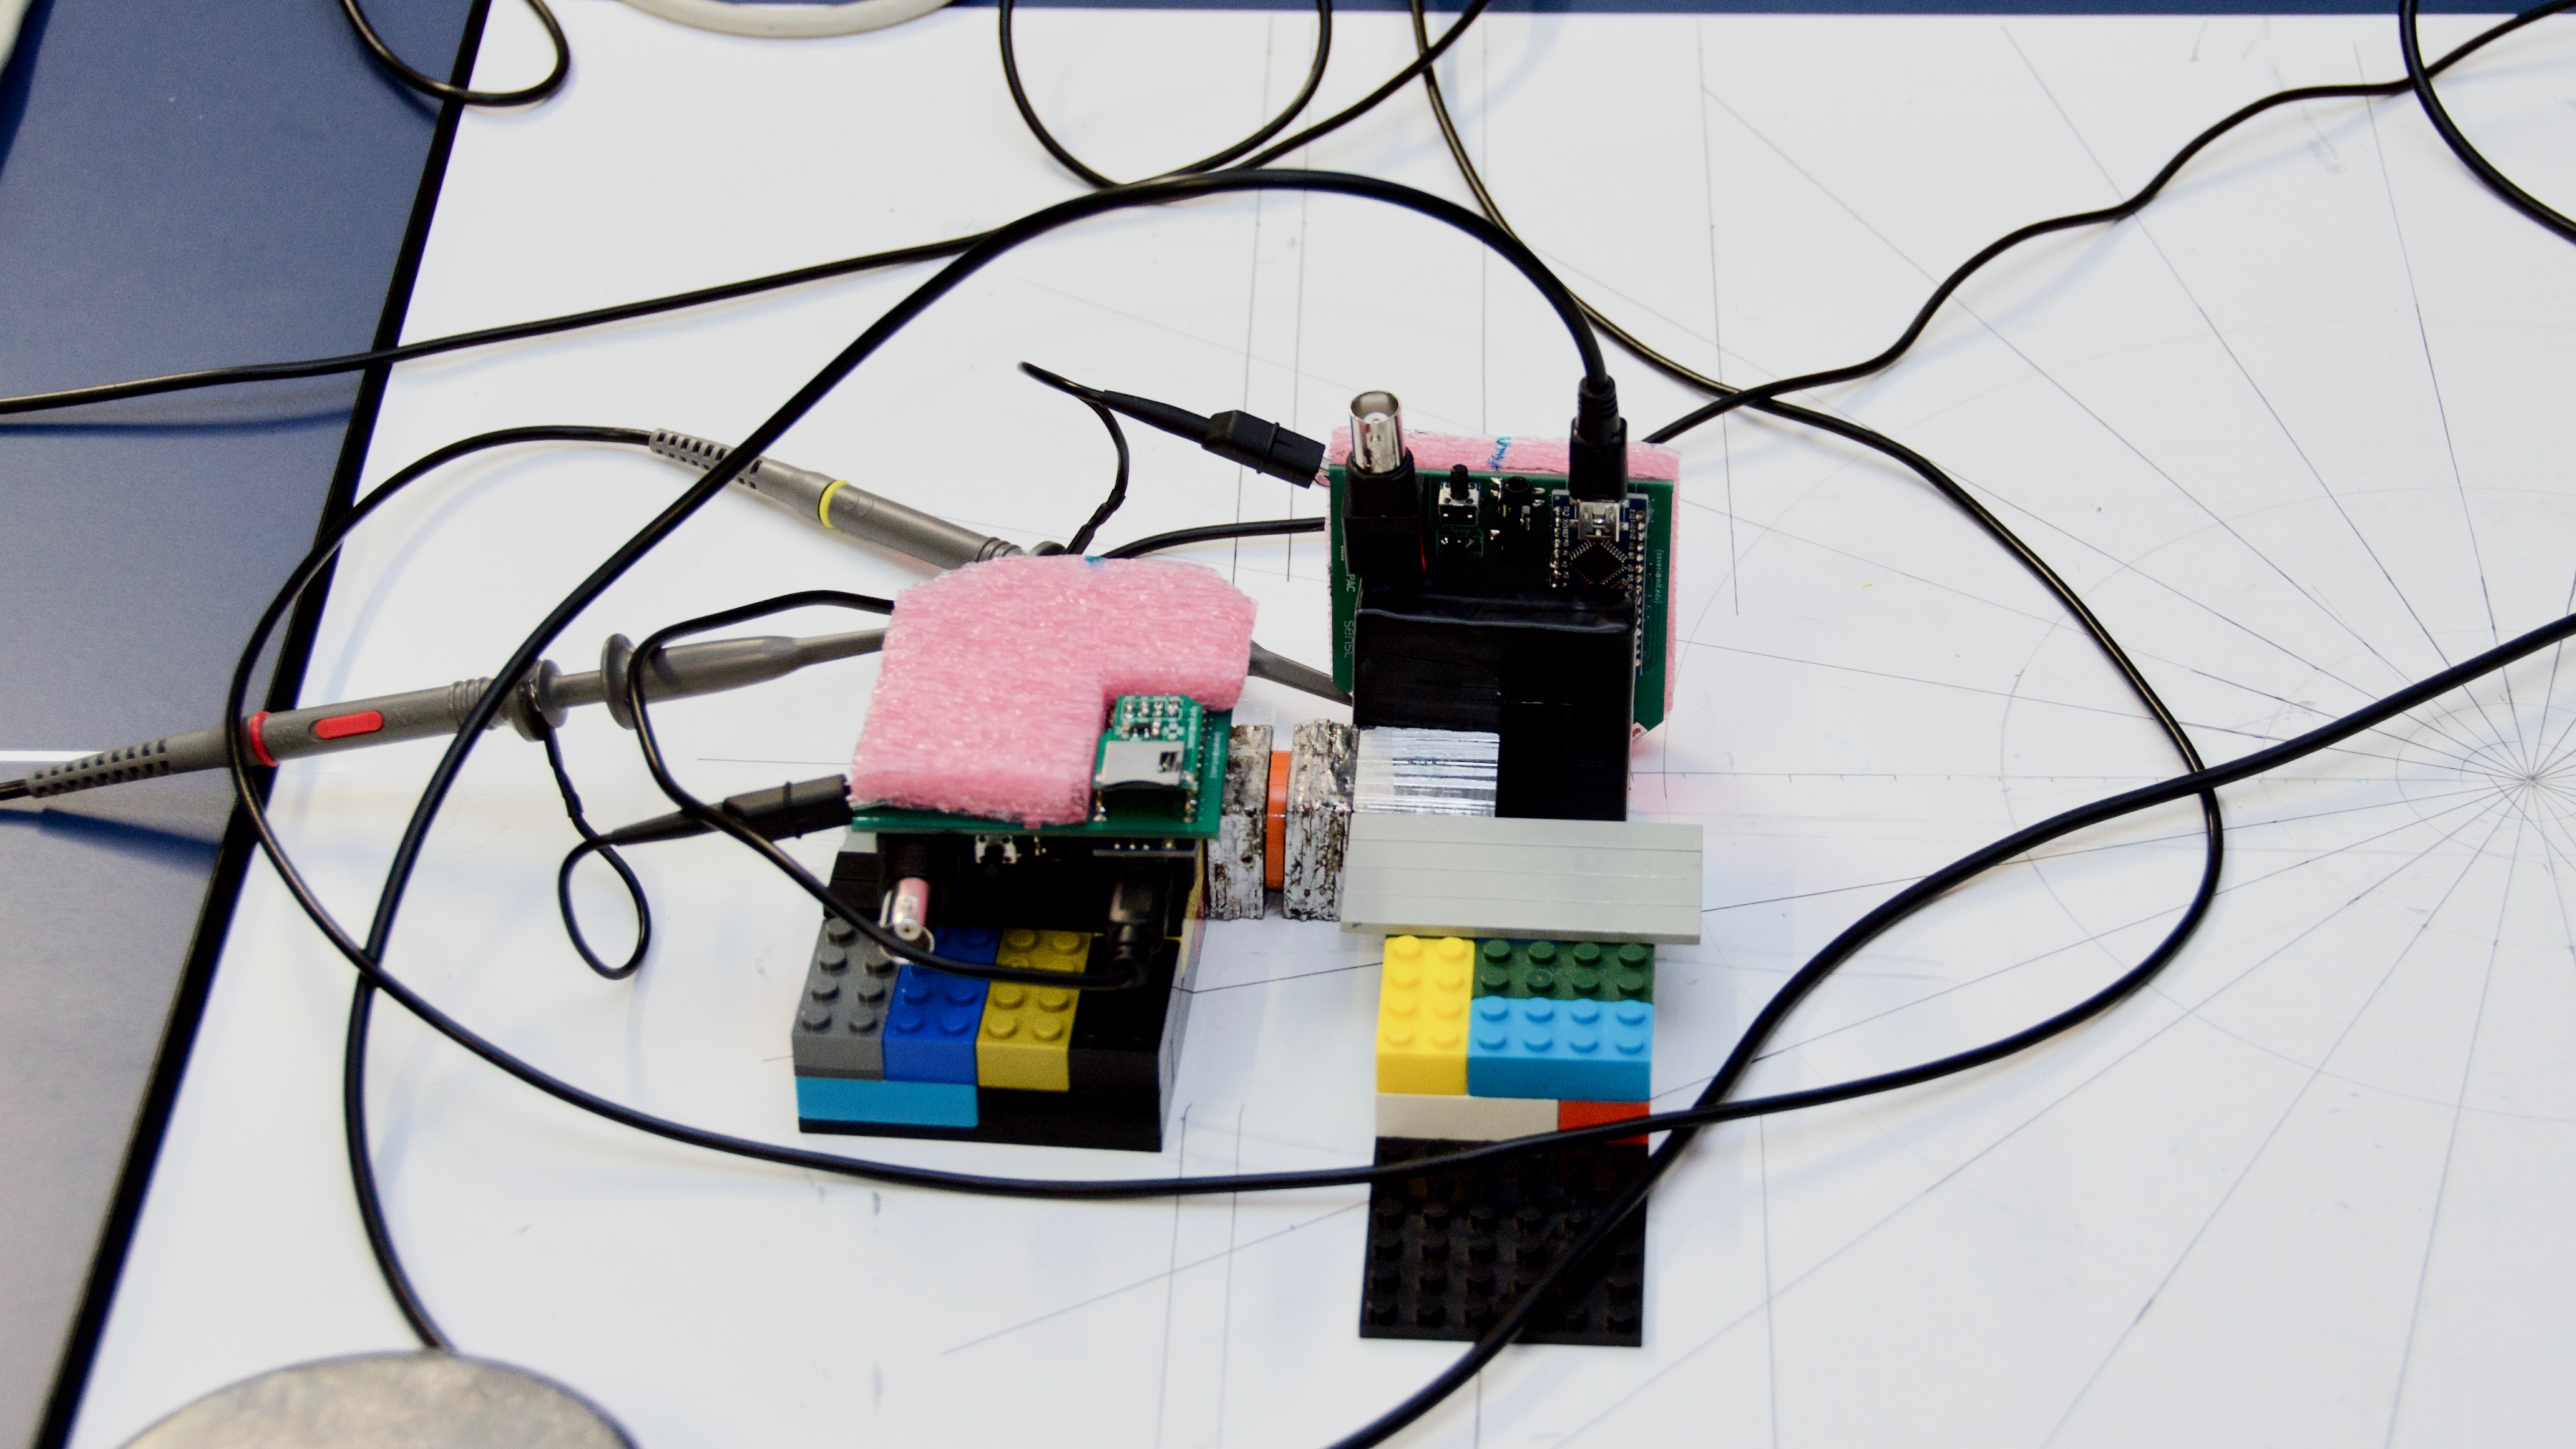
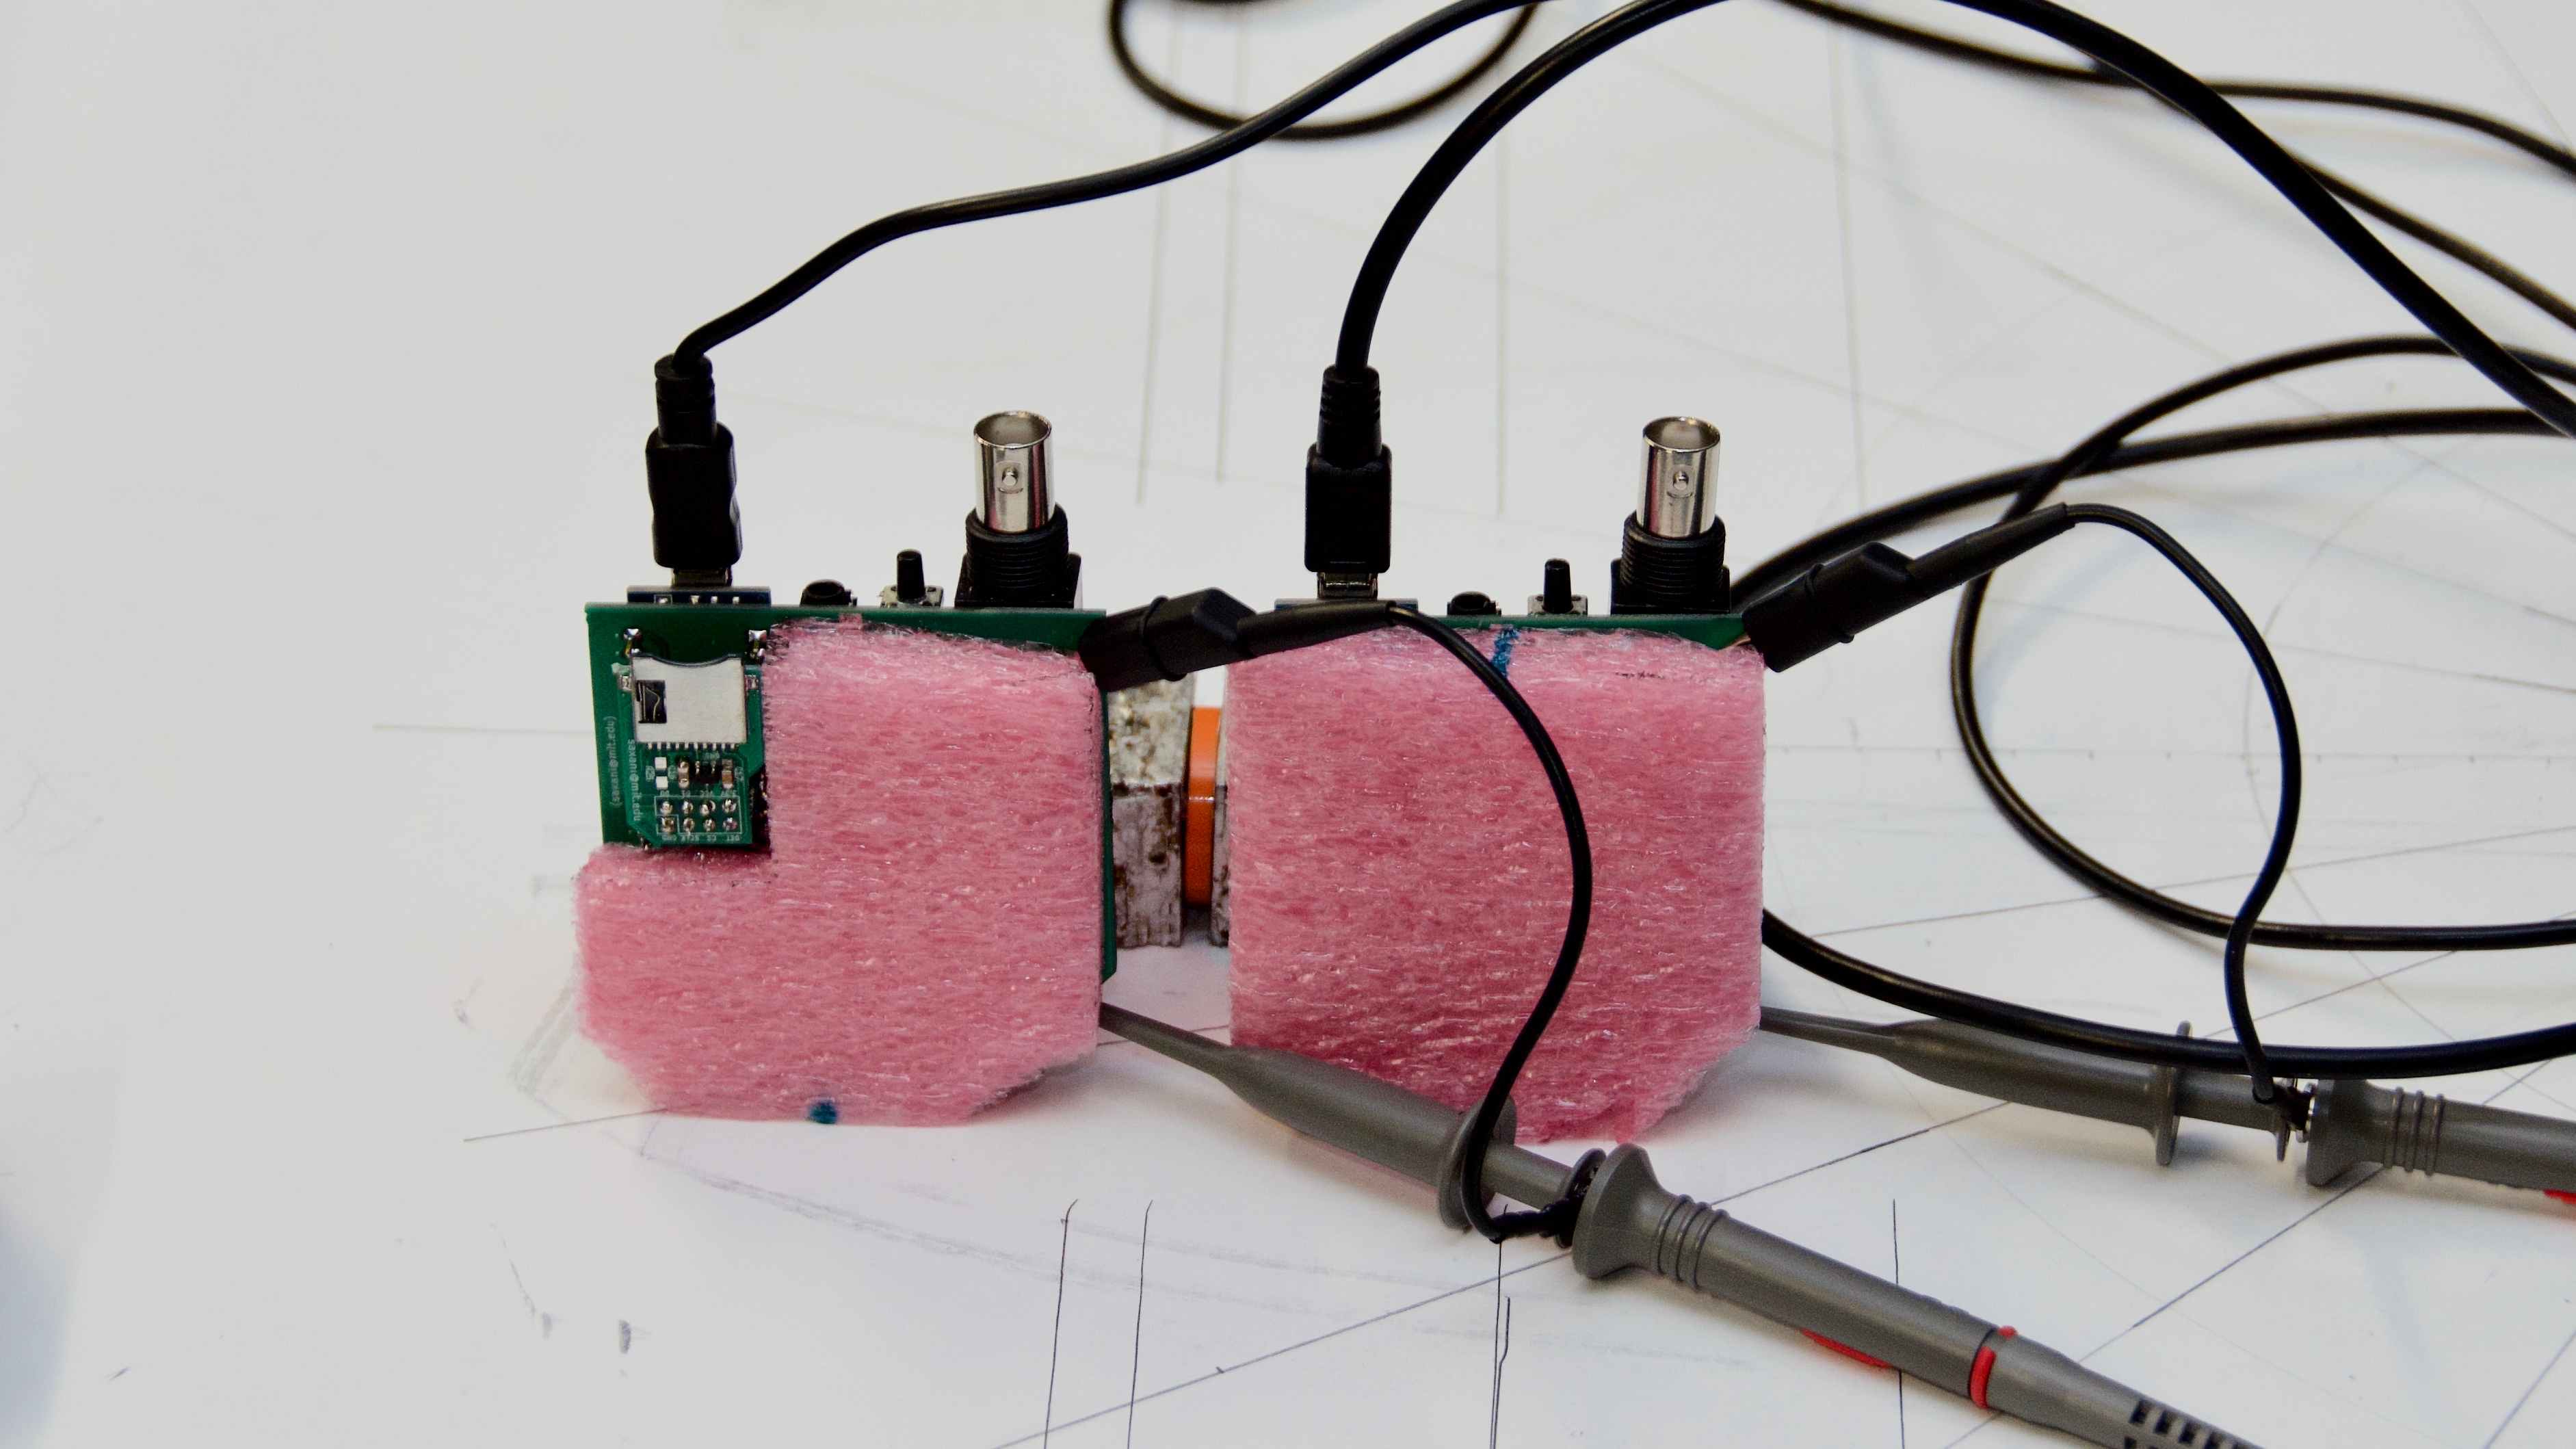 Figure 15: Experimental Setup
Description
Na produces positrons during decay. These particles annihilate with electrons, which produces two entangled photons as a results. The CosmicWatch particle detectors can detect these photons, but in order to determine if they are entangled, one has to check the coincidence rates for different orientations. This can help with determining entanglement, because entangled particles have orthogonal polarization, so aluminum cubes are used as polarizers, which scatters the photons at different angles due to polarity (Figure 3). The experiment tries to reproduce Wu-Shaknov's results.
Results
Because the total rates for the different orientations are different, due to the non-uniformity of the radioactive source, I added all of the total pulses together of the orientations that were orthogonal, and the orientations that were parallel, so that I would get an average rate for each.
Data Analysis
The quantum theory stating that entangled photons have orthogonal polarization was validated by data suggesting that the coincidence rate was higher when the detectors were oriented orthogonally. Although there is significant difference between orthogonal and perpendicular coincidence rates (25 times the standard deviation), the ratio is not as high as predicted by theory. The most likely reason is the imperfect experimental setup that was achieved outside of a laboratory.
Conclusions
- Two particle detectors were built for $130 each.
- Experiment 1 was performed to evaluate the detectors and choose the best way to measure radiation, which was via the amplified port.
- Experiment 2 demonstrates that the radiation source produces pairs of gamma photons from positron-electron annihilation, as well as the ability of the detectors to measure them by detecting if signals from the detectors come at the same time. It also shows that the radioactive source is not perfectly uniform.
- Experiment 3 demonstrates that the coincidence rate for orthogonal orientation of the detectors is greater than the parallel orientation rate, which confirms that we observe entangled photons with orthogonal linear polarization.
Acknowledgements
I would like to thank Dr. George Musser for giving me the idea to do this experiment. I would also like to thank Spencer Axani and Katarzyna Frankiewicz for their CosmicWatch project, which was a cheap alternative to a pre-made particle detector. Many thanks to my mentor.
References
Andrews University. Na-22 Spectrum. https://www.andrews.edu/phys/wiki/PhysLab/lib/exe/detail.php?id=272s11l12&media=lab14.fig.2.jpg
Axani, Spencer, and Katarzyna Frankiewicz. CosmicWatch. http://www.cosmicwatch.lns.mit.edu/
Bell, John S. "On the Einstein Podolsky Rosen paradox." Physics Physique Fizika 1.3 (1964): 195.
Bohm, David, and Yakir Aharonov. "Discussion of experimental proof for the paradox of Einstein, Rosen, and Podolsky." Physical Review 108.4 (1957): 1070.
Einstein, Albert, and Podolsky Boris, and Rosen Nathan, Phys. Rev. 47, 777 (1935).
George Musser. "How to Build Your Own Quantum Entanglement Experiment." Scientific American Blogs, Critical Opalescence. https://blogs.scientificamerican.com/critical-opalescence/how-to-build-your-own-quantum-entanglement-experiment-part-1-of-2/
Hamel, Matthieu, and Frederick Carrel. "Pseudo-gamma Spectrometry in Plastic Scintillators." New Insights on Gamma Rays. InTech, 2017.
Snyder, Hartland S., and Simon Pasternack, and J. Hornbostel. "Angular correlation of scattered annihilation radiation." Physical Review 73.5 (1948): 440.
Wikimedia. Compton scattering. https://commons.wikimedia.org/wiki/File:Compton-scattering.svg
Wikimedia. Neutron capture gamma spectrum of a radioactive Am-Be-source, measured with a germanium detector. https://commons.wikimedia.org/wiki/File:Am-Be-SourceSpectrum.jpg
Wikimedia. Positron-Electron Annihilation. https://commons.wikimedia.org/wiki/File:Annihilation.png
Wu, Chien-Shiung, and Irving Shaknov. "The angular correlation of scattered annihilation radiation." Physical Review 77.1 (1950): 136.